Native/Alaskan vs Immigrants from Morocco Median Female Earnings
COMPARE
Native/Alaskan
Immigrants from Morocco
Median Female Earnings
Median Female Earnings Comparison
Natives/Alaskans
Immigrants from Morocco
$33,806
MEDIAN FEMALE EARNINGS
0.0/ 100
METRIC RATING
331st/ 347
METRIC RANK
$42,229
MEDIAN FEMALE EARNINGS
99.5/ 100
METRIC RATING
82nd/ 347
METRIC RANK
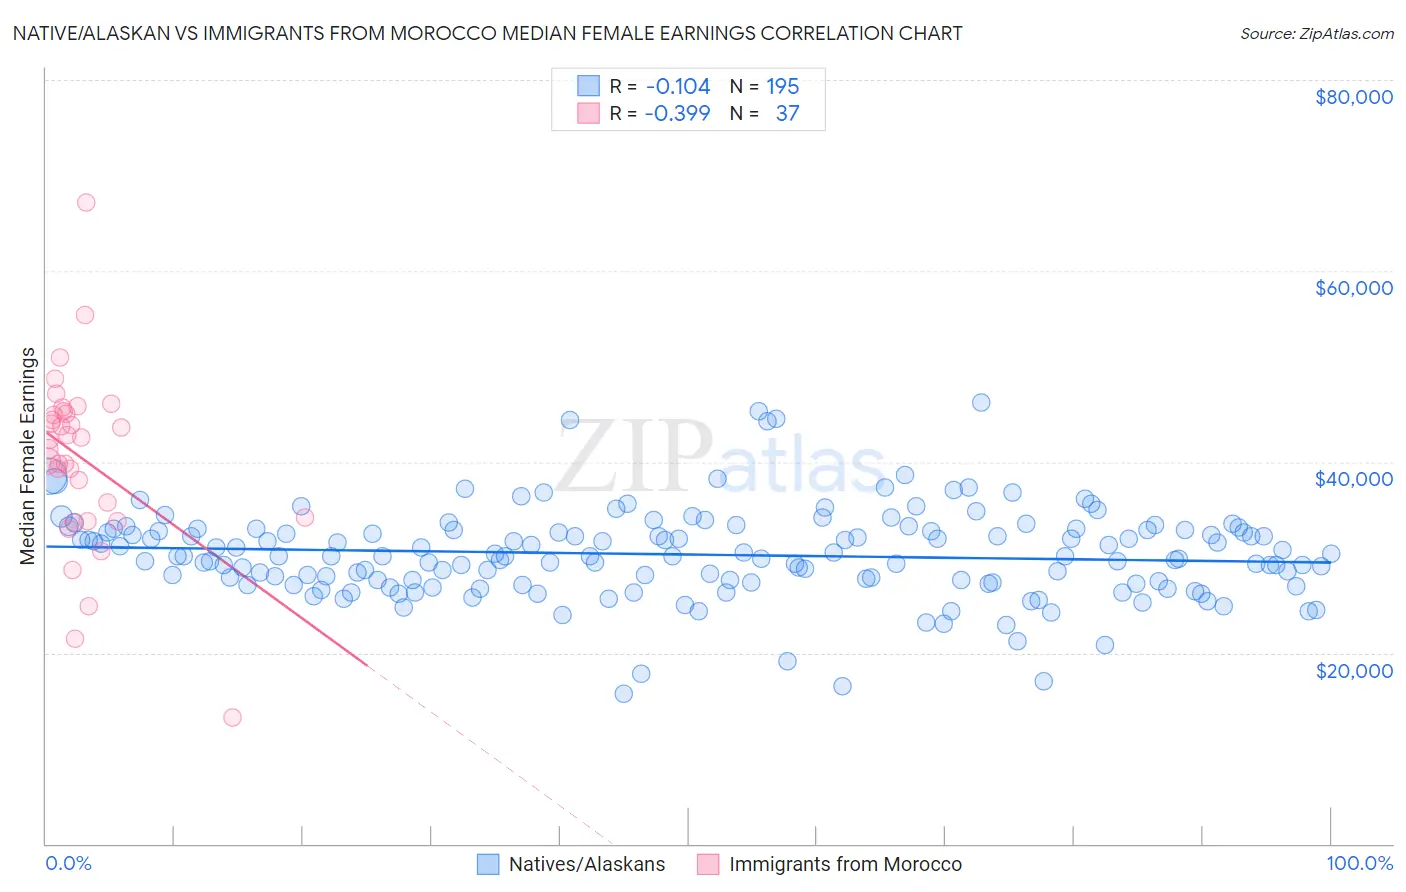
Native/Alaskan vs Immigrants from Morocco Median Female Earnings Correlation Chart
The statistical analysis conducted on geographies consisting of 512,112,793 people shows a poor negative correlation between the proportion of Natives/Alaskans and median female earnings in the United States with a correlation coefficient (R) of -0.104 and weighted average of $33,806. Similarly, the statistical analysis conducted on geographies consisting of 178,902,158 people shows a mild negative correlation between the proportion of Immigrants from Morocco and median female earnings in the United States with a correlation coefficient (R) of -0.399 and weighted average of $42,229, a difference of 24.9%.
Median Female Earnings Correlation Summary
| Measurement | Native/Alaskan | Immigrants from Morocco |
| Minimum | $15,696 | $13,173 |
| Maximum | $46,195 | $67,179 |
| Range | $30,499 | $54,006 |
| Mean | $30,297 | $40,274 |
| Median | $30,121 | $42,277 |
| Interquartile 25% (IQ1) | $27,399 | $34,012 |
| Interquartile 75% (IQ3) | $32,868 | $45,224 |
| Interquartile Range (IQR) | $5,469 | $11,212 |
| Standard Deviation (Sample) | $4,739 | $9,469 |
| Standard Deviation (Population) | $4,727 | $9,340 |
Similar Demographics by Median Female Earnings
Demographics Similar to Natives/Alaskans by Median Female Earnings
In terms of median female earnings, the demographic groups most similar to Natives/Alaskans are Choctaw ($33,775, a difference of 0.090%), Menominee ($33,894, a difference of 0.26%), Hopi ($33,932, a difference of 0.37%), Mexican ($33,664, a difference of 0.42%), and Immigrants from Central America ($33,953, a difference of 0.43%).
| Demographics | Rating | Rank | Median Female Earnings |
| Immigrants | Congo | 0.0 /100 | #324 | Tragic $34,317 |
| Dutch West Indians | 0.0 /100 | #325 | Tragic $34,106 |
| Kiowa | 0.0 /100 | #326 | Tragic $34,074 |
| Cajuns | 0.0 /100 | #327 | Tragic $34,034 |
| Immigrants | Central America | 0.0 /100 | #328 | Tragic $33,953 |
| Hopi | 0.0 /100 | #329 | Tragic $33,932 |
| Menominee | 0.0 /100 | #330 | Tragic $33,894 |
| Natives/Alaskans | 0.0 /100 | #331 | Tragic $33,806 |
| Choctaw | 0.0 /100 | #332 | Tragic $33,775 |
| Mexicans | 0.0 /100 | #333 | Tragic $33,664 |
| Spanish American Indians | 0.0 /100 | #334 | Tragic $33,625 |
| Creek | 0.0 /100 | #335 | Tragic $33,437 |
| Ottawa | 0.0 /100 | #336 | Tragic $33,378 |
| Yakama | 0.0 /100 | #337 | Tragic $33,354 |
| Immigrants | Cuba | 0.0 /100 | #338 | Tragic $33,291 |
Demographics Similar to Immigrants from Morocco by Median Female Earnings
In terms of median female earnings, the demographic groups most similar to Immigrants from Morocco are Immigrants from Sierra Leone ($42,214, a difference of 0.030%), Armenian ($42,212, a difference of 0.040%), Immigrants from Southern Europe ($42,275, a difference of 0.11%), Immigrants from Moldova ($42,304, a difference of 0.18%), and Laotian ($42,133, a difference of 0.23%).
| Demographics | Rating | Rank | Median Female Earnings |
| New Zealanders | 99.7 /100 | #75 | Exceptional $42,446 |
| Immigrants | Italy | 99.7 /100 | #76 | Exceptional $42,446 |
| Immigrants | Albania | 99.6 /100 | #77 | Exceptional $42,388 |
| Immigrants | Kazakhstan | 99.6 /100 | #78 | Exceptional $42,386 |
| Greeks | 99.6 /100 | #79 | Exceptional $42,336 |
| Immigrants | Moldova | 99.6 /100 | #80 | Exceptional $42,304 |
| Immigrants | Southern Europe | 99.5 /100 | #81 | Exceptional $42,275 |
| Immigrants | Morocco | 99.5 /100 | #82 | Exceptional $42,229 |
| Immigrants | Sierra Leone | 99.5 /100 | #83 | Exceptional $42,214 |
| Armenians | 99.5 /100 | #84 | Exceptional $42,212 |
| Laotians | 99.4 /100 | #85 | Exceptional $42,133 |
| Immigrants | St. Vincent and the Grenadines | 99.3 /100 | #86 | Exceptional $42,108 |
| Lithuanians | 99.3 /100 | #87 | Exceptional $42,108 |
| Immigrants | Northern Africa | 99.3 /100 | #88 | Exceptional $42,084 |
| Immigrants | Afghanistan | 99.3 /100 | #89 | Exceptional $42,055 |