Sudanese vs Immigrants from Hong Kong Median Household Income
COMPARE
Sudanese
Immigrants from Hong Kong
Median Household Income
Median Household Income Comparison
Sudanese
Immigrants from Hong Kong
$78,529
MEDIAN HOUSEHOLD INCOME
1.5/ 100
METRIC RATING
248th/ 347
METRIC RANK
$111,519
MEDIAN HOUSEHOLD INCOME
100.0/ 100
METRIC RATING
4th/ 347
METRIC RANK
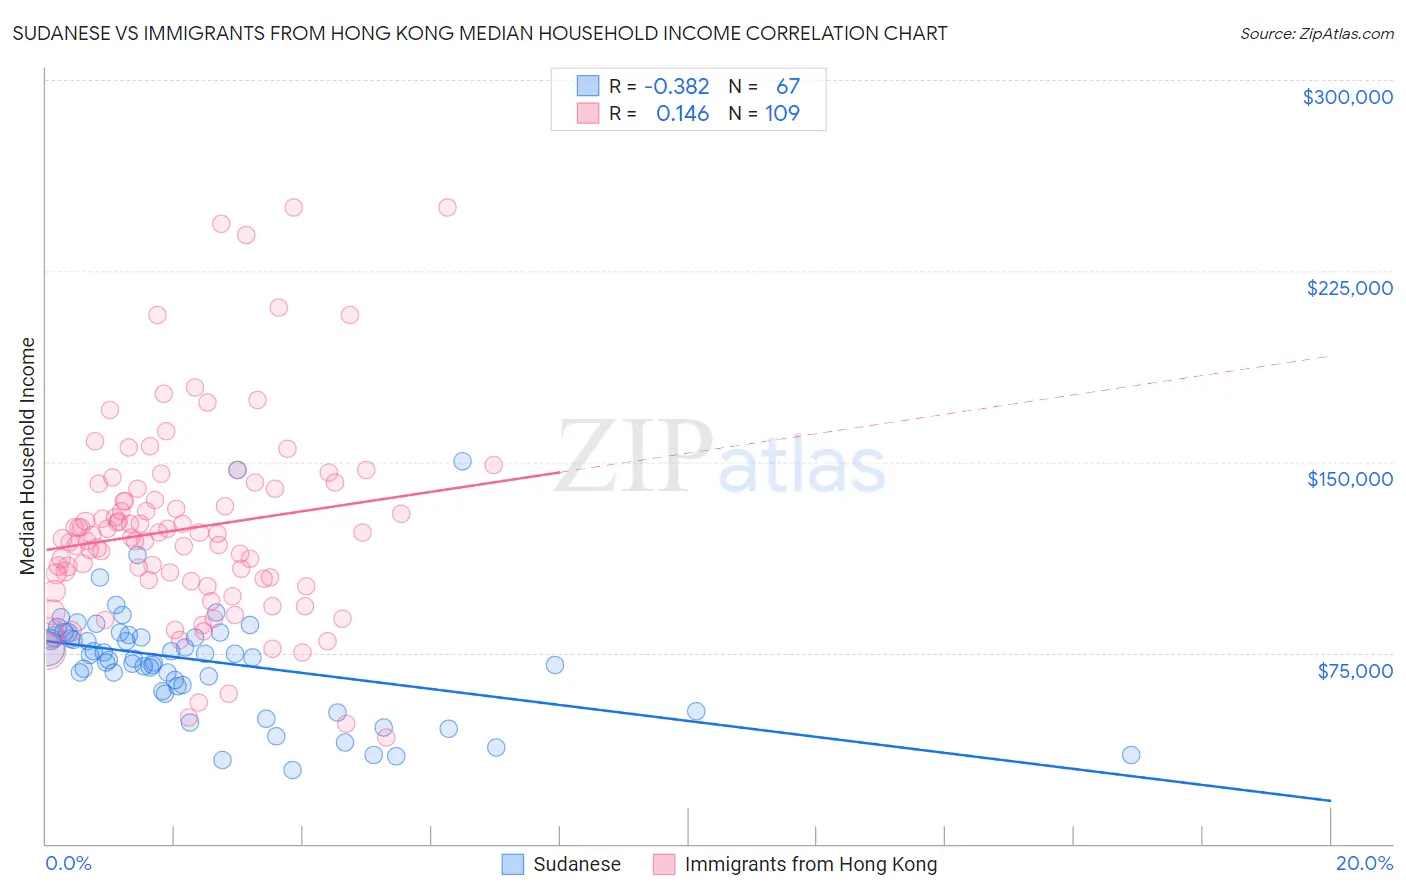
Sudanese vs Immigrants from Hong Kong Median Household Income Correlation Chart
The statistical analysis conducted on geographies consisting of 110,096,720 people shows a mild negative correlation between the proportion of Sudanese and median household income in the United States with a correlation coefficient (R) of -0.382 and weighted average of $78,529. Similarly, the statistical analysis conducted on geographies consisting of 253,858,060 people shows a poor positive correlation between the proportion of Immigrants from Hong Kong and median household income in the United States with a correlation coefficient (R) of 0.146 and weighted average of $111,519, a difference of 42.0%.
Median Household Income Correlation Summary
| Measurement | Sudanese | Immigrants from Hong Kong |
| Minimum | $28,750 | $41,563 |
| Maximum | $150,237 | $250,001 |
| Range | $121,487 | $208,438 |
| Mean | $71,874 | $123,651 |
| Median | $73,369 | $120,226 |
| Interquartile 25% (IQ1) | $61,639 | $102,101 |
| Interquartile 75% (IQ3) | $82,076 | $139,539 |
| Interquartile Range (IQR) | $20,437 | $37,437 |
| Standard Deviation (Sample) | $22,253 | $39,253 |
| Standard Deviation (Population) | $22,086 | $39,072 |
Similar Demographics by Median Household Income
Demographics Similar to Sudanese by Median Household Income
In terms of median household income, the demographic groups most similar to Sudanese are West Indian ($78,455, a difference of 0.090%), Immigrants from Burma/Myanmar ($78,682, a difference of 0.19%), Immigrants from Laos ($78,327, a difference of 0.26%), Central American ($78,803, a difference of 0.35%), and Inupiat ($78,841, a difference of 0.40%).
| Demographics | Rating | Rank | Median Household Income |
| Immigrants | Nonimmigrants | 2.6 /100 | #241 | Tragic $79,429 |
| Immigrants | Sudan | 2.1 /100 | #242 | Tragic $79,103 |
| Immigrants | Barbados | 1.9 /100 | #243 | Tragic $78,989 |
| Marshallese | 1.9 /100 | #244 | Tragic $78,930 |
| Inupiat | 1.8 /100 | #245 | Tragic $78,841 |
| Central Americans | 1.7 /100 | #246 | Tragic $78,803 |
| Immigrants | Burma/Myanmar | 1.6 /100 | #247 | Tragic $78,682 |
| Sudanese | 1.5 /100 | #248 | Tragic $78,529 |
| West Indians | 1.4 /100 | #249 | Tragic $78,455 |
| Immigrants | Laos | 1.3 /100 | #250 | Tragic $78,327 |
| Mexican American Indians | 1.2 /100 | #251 | Tragic $78,166 |
| Immigrants | West Indies | 1.0 /100 | #252 | Tragic $77,956 |
| Immigrants | St. Vincent and the Grenadines | 0.9 /100 | #253 | Tragic $77,690 |
| Sub-Saharan Africans | 0.8 /100 | #254 | Tragic $77,631 |
| Immigrants | Middle Africa | 0.8 /100 | #255 | Tragic $77,559 |
Demographics Similar to Immigrants from Hong Kong by Median Household Income
In terms of median household income, the demographic groups most similar to Immigrants from Hong Kong are Thai ($110,648, a difference of 0.79%), Immigrants from Singapore ($110,428, a difference of 0.99%), Immigrants from India ($113,009, a difference of 1.3%), Iranian ($109,835, a difference of 1.5%), and Immigrants from Iran ($108,055, a difference of 3.2%).
| Demographics | Rating | Rank | Median Household Income |
| Immigrants | Taiwan | 100.0 /100 | #1 | Exceptional $116,460 |
| Filipinos | 100.0 /100 | #2 | Exceptional $115,509 |
| Immigrants | India | 100.0 /100 | #3 | Exceptional $113,009 |
| Immigrants | Hong Kong | 100.0 /100 | #4 | Exceptional $111,519 |
| Thais | 100.0 /100 | #5 | Exceptional $110,648 |
| Immigrants | Singapore | 100.0 /100 | #6 | Exceptional $110,428 |
| Iranians | 100.0 /100 | #7 | Exceptional $109,835 |
| Immigrants | Iran | 100.0 /100 | #8 | Exceptional $108,055 |
| Okinawans | 100.0 /100 | #9 | Exceptional $106,624 |
| Immigrants | South Central Asia | 100.0 /100 | #10 | Exceptional $106,057 |
| Immigrants | China | 100.0 /100 | #11 | Exceptional $105,335 |
| Indians (Asian) | 100.0 /100 | #12 | Exceptional $105,262 |
| Immigrants | Eastern Asia | 100.0 /100 | #13 | Exceptional $104,796 |
| Immigrants | Ireland | 100.0 /100 | #14 | Exceptional $104,692 |
| Immigrants | Israel | 100.0 /100 | #15 | Exceptional $104,090 |