Sudanese vs Immigrants from Bahamas Median Household Income
COMPARE
Sudanese
Immigrants from Bahamas
Median Household Income
Median Household Income Comparison
Sudanese
Immigrants from Bahamas
$78,529
MEDIAN HOUSEHOLD INCOME
1.5/ 100
METRIC RATING
248th/ 347
METRIC RANK
$71,349
MEDIAN HOUSEHOLD INCOME
0.0/ 100
METRIC RATING
313th/ 347
METRIC RANK
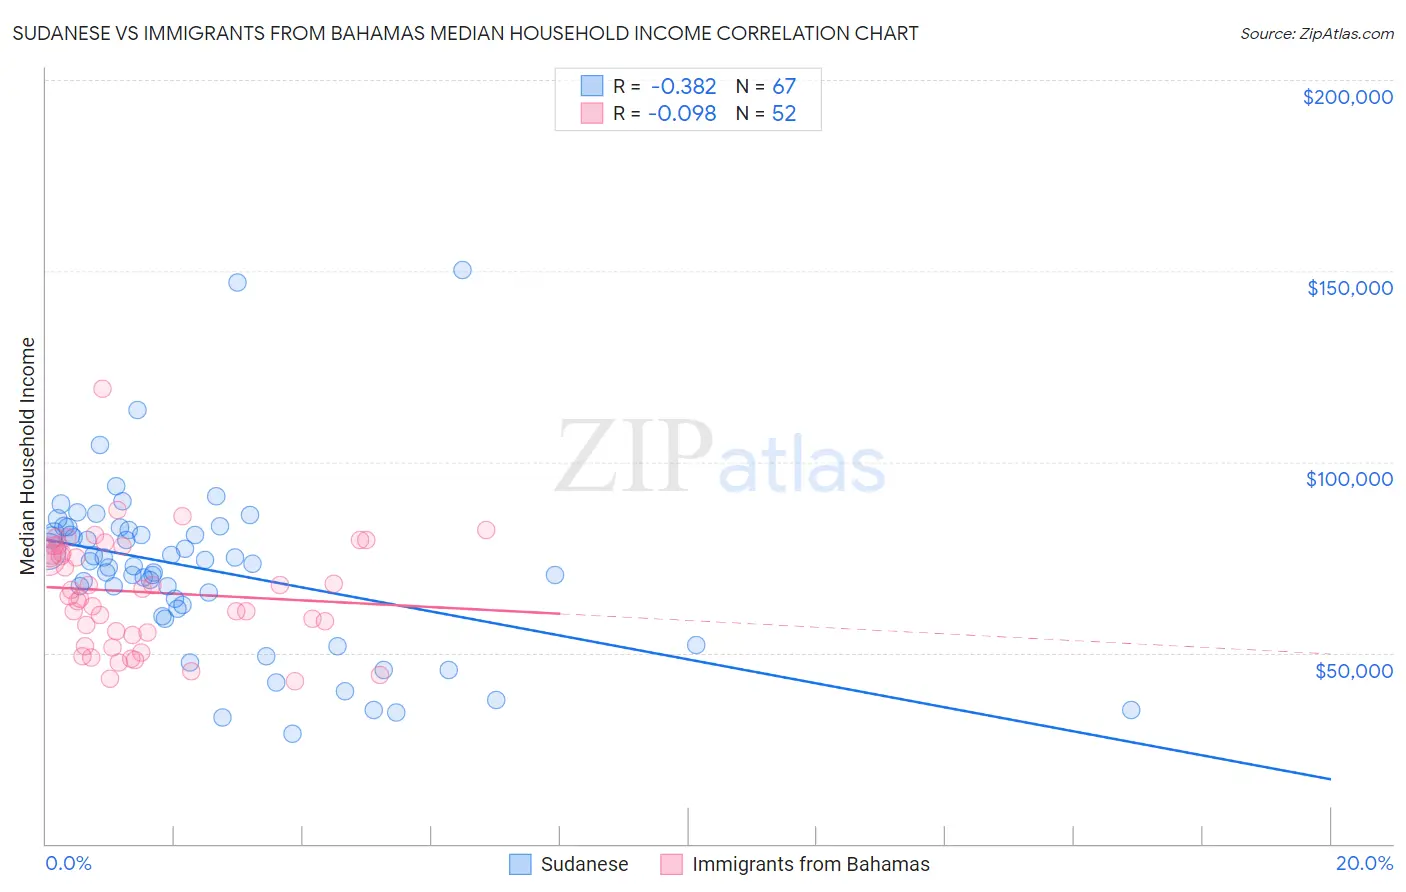
Sudanese vs Immigrants from Bahamas Median Household Income Correlation Chart
The statistical analysis conducted on geographies consisting of 110,096,720 people shows a mild negative correlation between the proportion of Sudanese and median household income in the United States with a correlation coefficient (R) of -0.382 and weighted average of $78,529. Similarly, the statistical analysis conducted on geographies consisting of 104,583,931 people shows a slight negative correlation between the proportion of Immigrants from Bahamas and median household income in the United States with a correlation coefficient (R) of -0.098 and weighted average of $71,349, a difference of 10.1%.
Median Household Income Correlation Summary
| Measurement | Sudanese | Immigrants from Bahamas |
| Minimum | $28,750 | $42,496 |
| Maximum | $150,237 | $119,201 |
| Range | $121,487 | $76,705 |
| Mean | $71,874 | $65,863 |
| Median | $73,369 | $65,628 |
| Interquartile 25% (IQ1) | $61,639 | $55,065 |
| Interquartile 75% (IQ3) | $82,076 | $76,891 |
| Interquartile Range (IQR) | $20,437 | $21,825 |
| Standard Deviation (Sample) | $22,253 | $14,679 |
| Standard Deviation (Population) | $22,086 | $14,537 |
Similar Demographics by Median Household Income
Demographics Similar to Sudanese by Median Household Income
In terms of median household income, the demographic groups most similar to Sudanese are West Indian ($78,455, a difference of 0.090%), Immigrants from Burma/Myanmar ($78,682, a difference of 0.19%), Immigrants from Laos ($78,327, a difference of 0.26%), Central American ($78,803, a difference of 0.35%), and Inupiat ($78,841, a difference of 0.40%).
| Demographics | Rating | Rank | Median Household Income |
| Immigrants | Nonimmigrants | 2.6 /100 | #241 | Tragic $79,429 |
| Immigrants | Sudan | 2.1 /100 | #242 | Tragic $79,103 |
| Immigrants | Barbados | 1.9 /100 | #243 | Tragic $78,989 |
| Marshallese | 1.9 /100 | #244 | Tragic $78,930 |
| Inupiat | 1.8 /100 | #245 | Tragic $78,841 |
| Central Americans | 1.7 /100 | #246 | Tragic $78,803 |
| Immigrants | Burma/Myanmar | 1.6 /100 | #247 | Tragic $78,682 |
| Sudanese | 1.5 /100 | #248 | Tragic $78,529 |
| West Indians | 1.4 /100 | #249 | Tragic $78,455 |
| Immigrants | Laos | 1.3 /100 | #250 | Tragic $78,327 |
| Mexican American Indians | 1.2 /100 | #251 | Tragic $78,166 |
| Immigrants | West Indies | 1.0 /100 | #252 | Tragic $77,956 |
| Immigrants | St. Vincent and the Grenadines | 0.9 /100 | #253 | Tragic $77,690 |
| Sub-Saharan Africans | 0.8 /100 | #254 | Tragic $77,631 |
| Immigrants | Middle Africa | 0.8 /100 | #255 | Tragic $77,559 |
Demographics Similar to Immigrants from Bahamas by Median Household Income
In terms of median household income, the demographic groups most similar to Immigrants from Bahamas are Dominican ($71,302, a difference of 0.060%), Immigrants from Honduras ($71,452, a difference of 0.15%), Ottawa ($70,984, a difference of 0.51%), Apache ($70,927, a difference of 0.59%), and Immigrants from Zaire ($71,801, a difference of 0.63%).
| Demographics | Rating | Rank | Median Household Income |
| Potawatomi | 0.0 /100 | #306 | Tragic $72,576 |
| Ute | 0.0 /100 | #307 | Tragic $72,402 |
| Yakama | 0.0 /100 | #308 | Tragic $72,225 |
| Immigrants | Caribbean | 0.0 /100 | #309 | Tragic $71,860 |
| U.S. Virgin Islanders | 0.0 /100 | #310 | Tragic $71,853 |
| Immigrants | Zaire | 0.0 /100 | #311 | Tragic $71,801 |
| Immigrants | Honduras | 0.0 /100 | #312 | Tragic $71,452 |
| Immigrants | Bahamas | 0.0 /100 | #313 | Tragic $71,349 |
| Dominicans | 0.0 /100 | #314 | Tragic $71,302 |
| Ottawa | 0.0 /100 | #315 | Tragic $70,984 |
| Apache | 0.0 /100 | #316 | Tragic $70,927 |
| Cajuns | 0.0 /100 | #317 | Tragic $70,605 |
| Chippewa | 0.0 /100 | #318 | Tragic $70,539 |
| Immigrants | Dominican Republic | 0.0 /100 | #319 | Tragic $70,208 |
| Colville | 0.0 /100 | #320 | Tragic $70,094 |