Cape Verdean vs Immigrants from Hong Kong Median Household Income
COMPARE
Cape Verdean
Immigrants from Hong Kong
Median Household Income
Median Household Income Comparison
Cape Verdeans
Immigrants from Hong Kong
$75,848
MEDIAN HOUSEHOLD INCOME
0.3/ 100
METRIC RATING
269th/ 347
METRIC RANK
$111,519
MEDIAN HOUSEHOLD INCOME
100.0/ 100
METRIC RATING
4th/ 347
METRIC RANK
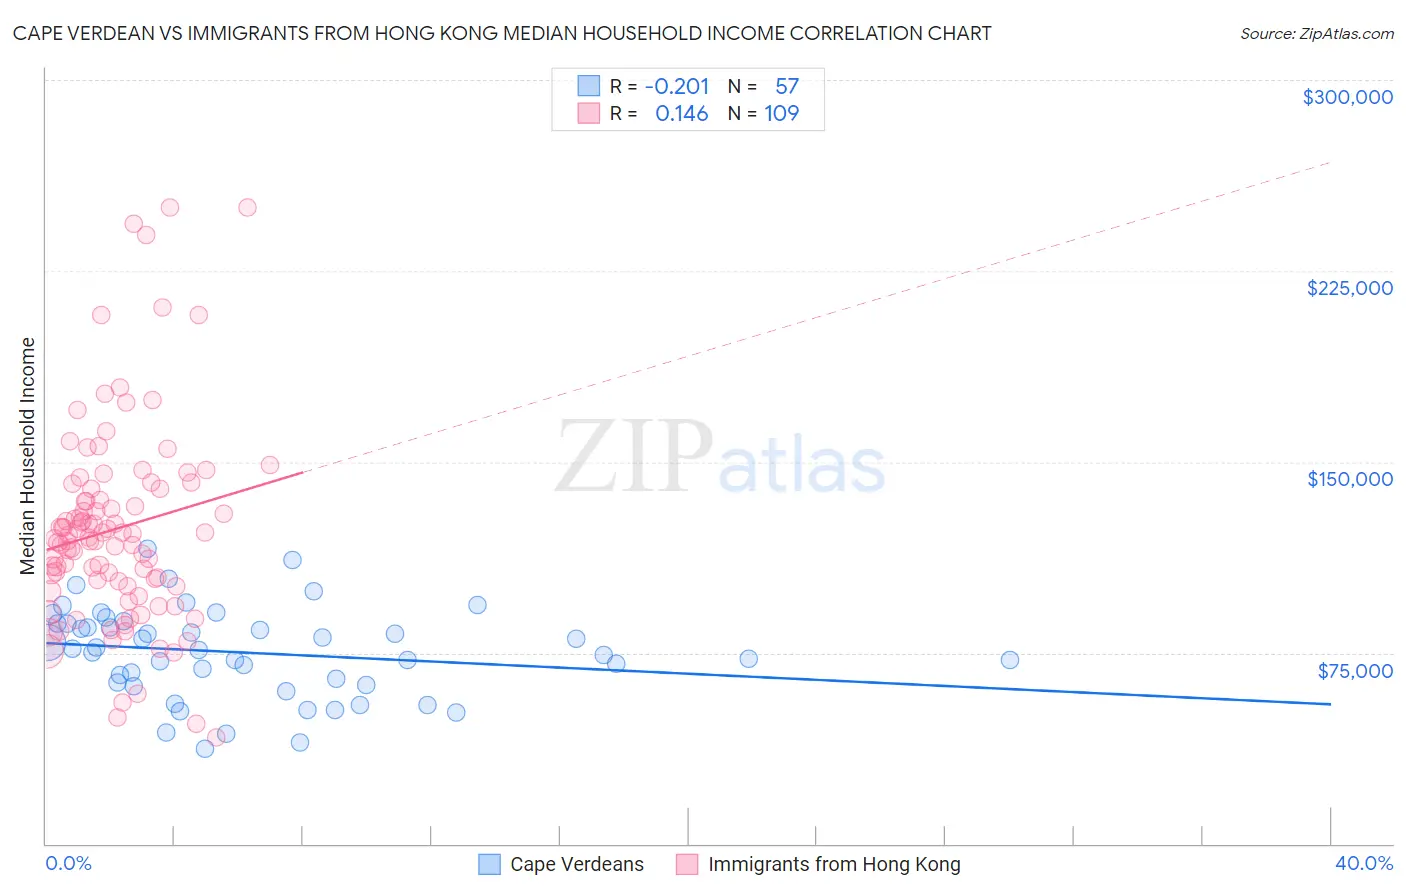
Cape Verdean vs Immigrants from Hong Kong Median Household Income Correlation Chart
The statistical analysis conducted on geographies consisting of 107,534,548 people shows a weak negative correlation between the proportion of Cape Verdeans and median household income in the United States with a correlation coefficient (R) of -0.201 and weighted average of $75,848. Similarly, the statistical analysis conducted on geographies consisting of 253,858,060 people shows a poor positive correlation between the proportion of Immigrants from Hong Kong and median household income in the United States with a correlation coefficient (R) of 0.146 and weighted average of $111,519, a difference of 47.0%.
Median Household Income Correlation Summary
| Measurement | Cape Verdean | Immigrants from Hong Kong |
| Minimum | $37,158 | $41,563 |
| Maximum | $115,791 | $250,001 |
| Range | $78,633 | $208,438 |
| Mean | $75,036 | $123,651 |
| Median | $76,048 | $120,226 |
| Interquartile 25% (IQ1) | $63,051 | $102,101 |
| Interquartile 75% (IQ3) | $86,492 | $139,539 |
| Interquartile Range (IQR) | $23,441 | $37,437 |
| Standard Deviation (Sample) | $17,562 | $39,253 |
| Standard Deviation (Population) | $17,408 | $39,072 |
Similar Demographics by Median Household Income
Demographics Similar to Cape Verdeans by Median Household Income
In terms of median household income, the demographic groups most similar to Cape Verdeans are Immigrants from Jamaica ($75,851, a difference of 0.0%), German Russian ($75,856, a difference of 0.010%), Hmong ($75,839, a difference of 0.010%), Pennsylvania German ($75,814, a difference of 0.050%), and Somali ($75,782, a difference of 0.090%).
| Demographics | Rating | Rank | Median Household Income |
| French American Indians | 0.4 /100 | #262 | Tragic $76,387 |
| Alaskan Athabascans | 0.4 /100 | #263 | Tragic $76,383 |
| Guatemalans | 0.3 /100 | #264 | Tragic $75,961 |
| Immigrants | Belize | 0.3 /100 | #265 | Tragic $75,938 |
| Americans | 0.3 /100 | #266 | Tragic $75,932 |
| German Russians | 0.3 /100 | #267 | Tragic $75,856 |
| Immigrants | Jamaica | 0.3 /100 | #268 | Tragic $75,851 |
| Cape Verdeans | 0.3 /100 | #269 | Tragic $75,848 |
| Hmong | 0.3 /100 | #270 | Tragic $75,839 |
| Pennsylvania Germans | 0.3 /100 | #271 | Tragic $75,814 |
| Somalis | 0.3 /100 | #272 | Tragic $75,782 |
| Liberians | 0.2 /100 | #273 | Tragic $75,667 |
| British West Indians | 0.2 /100 | #274 | Tragic $75,647 |
| Immigrants | Micronesia | 0.2 /100 | #275 | Tragic $75,574 |
| Immigrants | Latin America | 0.2 /100 | #276 | Tragic $75,420 |
Demographics Similar to Immigrants from Hong Kong by Median Household Income
In terms of median household income, the demographic groups most similar to Immigrants from Hong Kong are Thai ($110,648, a difference of 0.79%), Immigrants from Singapore ($110,428, a difference of 0.99%), Immigrants from India ($113,009, a difference of 1.3%), Iranian ($109,835, a difference of 1.5%), and Immigrants from Iran ($108,055, a difference of 3.2%).
| Demographics | Rating | Rank | Median Household Income |
| Immigrants | Taiwan | 100.0 /100 | #1 | Exceptional $116,460 |
| Filipinos | 100.0 /100 | #2 | Exceptional $115,509 |
| Immigrants | India | 100.0 /100 | #3 | Exceptional $113,009 |
| Immigrants | Hong Kong | 100.0 /100 | #4 | Exceptional $111,519 |
| Thais | 100.0 /100 | #5 | Exceptional $110,648 |
| Immigrants | Singapore | 100.0 /100 | #6 | Exceptional $110,428 |
| Iranians | 100.0 /100 | #7 | Exceptional $109,835 |
| Immigrants | Iran | 100.0 /100 | #8 | Exceptional $108,055 |
| Okinawans | 100.0 /100 | #9 | Exceptional $106,624 |
| Immigrants | South Central Asia | 100.0 /100 | #10 | Exceptional $106,057 |
| Immigrants | China | 100.0 /100 | #11 | Exceptional $105,335 |
| Indians (Asian) | 100.0 /100 | #12 | Exceptional $105,262 |
| Immigrants | Eastern Asia | 100.0 /100 | #13 | Exceptional $104,796 |
| Immigrants | Ireland | 100.0 /100 | #14 | Exceptional $104,692 |
| Immigrants | Israel | 100.0 /100 | #15 | Exceptional $104,090 |