Sudanese vs Immigrants from Kuwait Median Household Income
COMPARE
Sudanese
Immigrants from Kuwait
Median Household Income
Median Household Income Comparison
Sudanese
Immigrants from Kuwait
$78,529
MEDIAN HOUSEHOLD INCOME
1.5/ 100
METRIC RATING
248th/ 347
METRIC RANK
$89,263
MEDIAN HOUSEHOLD INCOME
93.5/ 100
METRIC RATING
125th/ 347
METRIC RANK
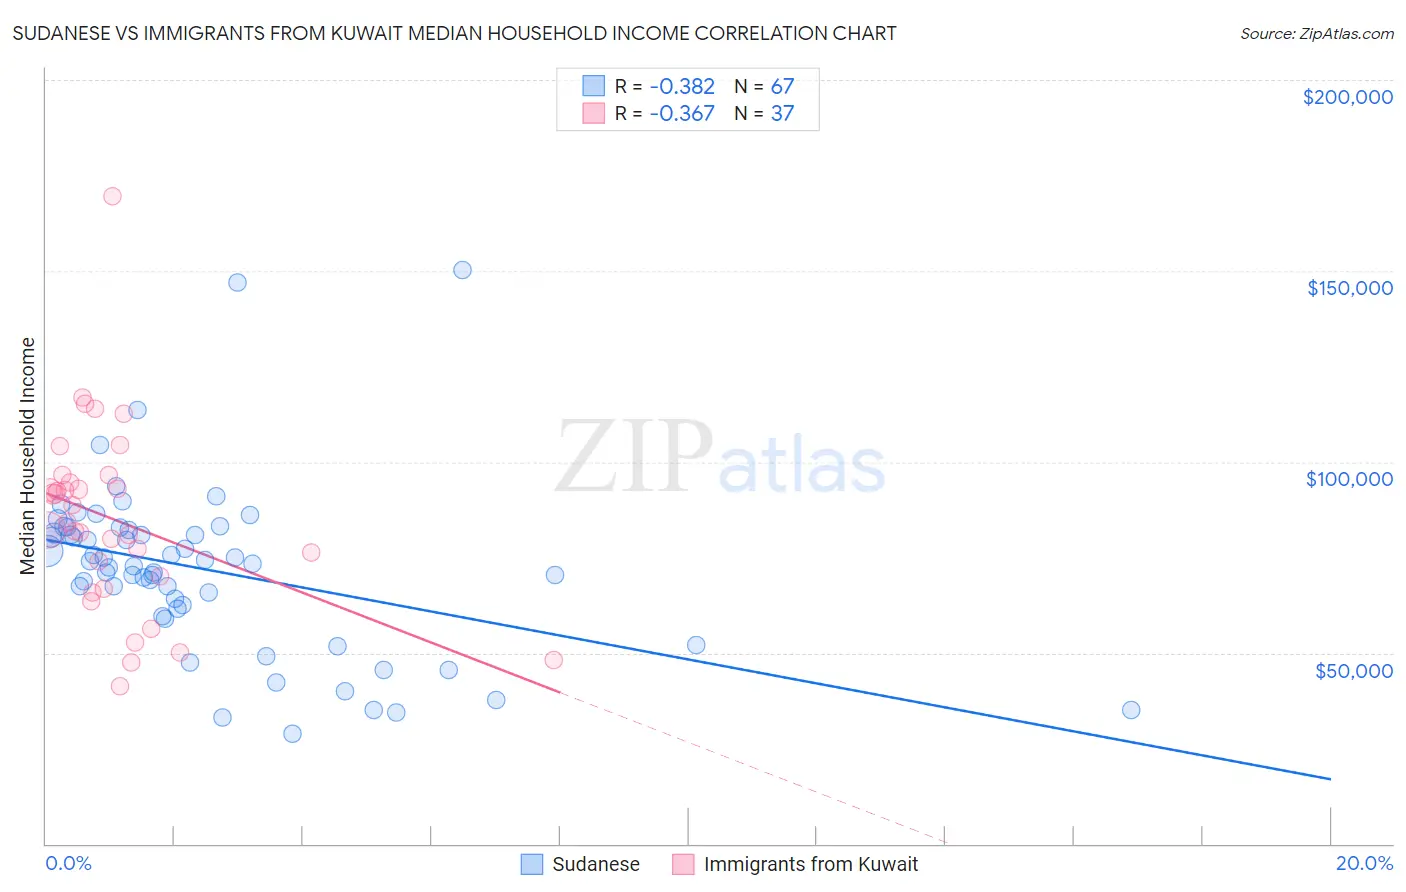
Sudanese vs Immigrants from Kuwait Median Household Income Correlation Chart
The statistical analysis conducted on geographies consisting of 110,096,720 people shows a mild negative correlation between the proportion of Sudanese and median household income in the United States with a correlation coefficient (R) of -0.382 and weighted average of $78,529. Similarly, the statistical analysis conducted on geographies consisting of 136,867,834 people shows a mild negative correlation between the proportion of Immigrants from Kuwait and median household income in the United States with a correlation coefficient (R) of -0.367 and weighted average of $89,263, a difference of 13.7%.
Median Household Income Correlation Summary
| Measurement | Sudanese | Immigrants from Kuwait |
| Minimum | $28,750 | $41,103 |
| Maximum | $150,237 | $169,621 |
| Range | $121,487 | $128,518 |
| Mean | $71,874 | $84,844 |
| Median | $73,369 | $84,244 |
| Interquartile 25% (IQ1) | $61,639 | $68,396 |
| Interquartile 75% (IQ3) | $82,076 | $95,528 |
| Interquartile Range (IQR) | $20,437 | $27,132 |
| Standard Deviation (Sample) | $22,253 | $24,541 |
| Standard Deviation (Population) | $22,086 | $24,207 |
Similar Demographics by Median Household Income
Demographics Similar to Sudanese by Median Household Income
In terms of median household income, the demographic groups most similar to Sudanese are West Indian ($78,455, a difference of 0.090%), Immigrants from Burma/Myanmar ($78,682, a difference of 0.19%), Immigrants from Laos ($78,327, a difference of 0.26%), Central American ($78,803, a difference of 0.35%), and Inupiat ($78,841, a difference of 0.40%).
| Demographics | Rating | Rank | Median Household Income |
| Immigrants | Nonimmigrants | 2.6 /100 | #241 | Tragic $79,429 |
| Immigrants | Sudan | 2.1 /100 | #242 | Tragic $79,103 |
| Immigrants | Barbados | 1.9 /100 | #243 | Tragic $78,989 |
| Marshallese | 1.9 /100 | #244 | Tragic $78,930 |
| Inupiat | 1.8 /100 | #245 | Tragic $78,841 |
| Central Americans | 1.7 /100 | #246 | Tragic $78,803 |
| Immigrants | Burma/Myanmar | 1.6 /100 | #247 | Tragic $78,682 |
| Sudanese | 1.5 /100 | #248 | Tragic $78,529 |
| West Indians | 1.4 /100 | #249 | Tragic $78,455 |
| Immigrants | Laos | 1.3 /100 | #250 | Tragic $78,327 |
| Mexican American Indians | 1.2 /100 | #251 | Tragic $78,166 |
| Immigrants | West Indies | 1.0 /100 | #252 | Tragic $77,956 |
| Immigrants | St. Vincent and the Grenadines | 0.9 /100 | #253 | Tragic $77,690 |
| Sub-Saharan Africans | 0.8 /100 | #254 | Tragic $77,631 |
| Immigrants | Middle Africa | 0.8 /100 | #255 | Tragic $77,559 |
Demographics Similar to Immigrants from Kuwait by Median Household Income
In terms of median household income, the demographic groups most similar to Immigrants from Kuwait are Immigrants from Jordan ($89,412, a difference of 0.17%), Immigrants from Oceania ($89,100, a difference of 0.18%), Immigrants from Zimbabwe ($89,496, a difference of 0.26%), Immigrants from Peru ($89,010, a difference of 0.28%), and Portuguese ($88,976, a difference of 0.32%).
| Demographics | Rating | Rank | Median Household Income |
| Syrians | 95.4 /100 | #118 | Exceptional $89,830 |
| Albanians | 95.2 /100 | #119 | Exceptional $89,744 |
| Immigrants | North Macedonia | 95.2 /100 | #120 | Exceptional $89,741 |
| Ethiopians | 94.9 /100 | #121 | Exceptional $89,640 |
| Pakistanis | 94.8 /100 | #122 | Exceptional $89,638 |
| Immigrants | Zimbabwe | 94.4 /100 | #123 | Exceptional $89,496 |
| Immigrants | Jordan | 94.1 /100 | #124 | Exceptional $89,412 |
| Immigrants | Kuwait | 93.5 /100 | #125 | Exceptional $89,263 |
| Immigrants | Oceania | 92.9 /100 | #126 | Exceptional $89,100 |
| Immigrants | Peru | 92.5 /100 | #127 | Exceptional $89,010 |
| Portuguese | 92.3 /100 | #128 | Exceptional $88,976 |
| Brazilians | 92.1 /100 | #129 | Exceptional $88,934 |
| British | 92.0 /100 | #130 | Exceptional $88,914 |
| Immigrants | Syria | 91.4 /100 | #131 | Exceptional $88,792 |
| Europeans | 91.2 /100 | #132 | Exceptional $88,751 |