Sudanese vs Immigrants from Ghana Median Household Income
COMPARE
Sudanese
Immigrants from Ghana
Median Household Income
Median Household Income Comparison
Sudanese
Immigrants from Ghana
$78,529
MEDIAN HOUSEHOLD INCOME
1.5/ 100
METRIC RATING
248th/ 347
METRIC RANK
$81,489
MEDIAN HOUSEHOLD INCOME
9.0/ 100
METRIC RATING
221st/ 347
METRIC RANK
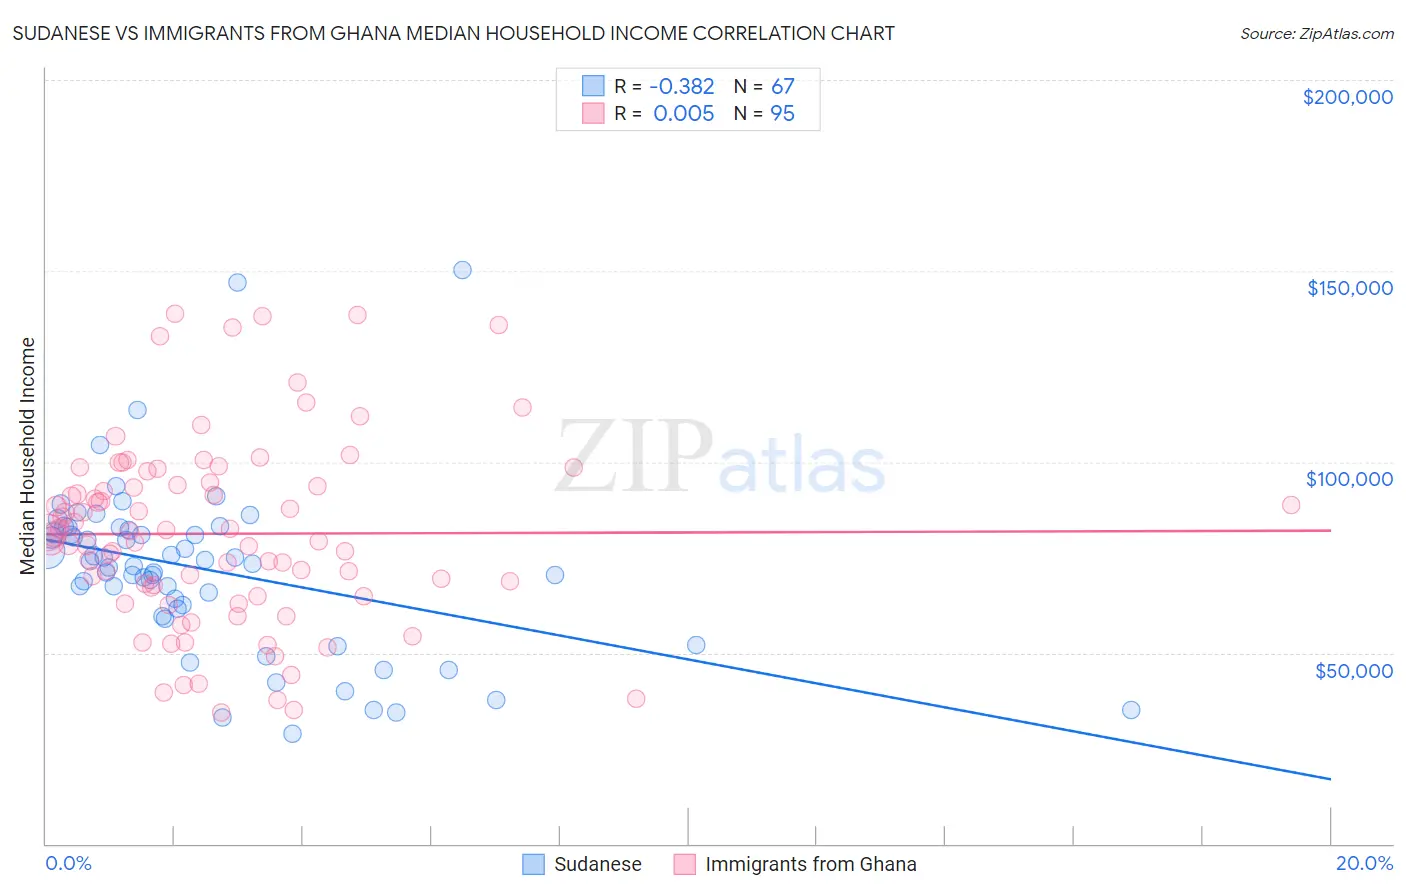
Sudanese vs Immigrants from Ghana Median Household Income Correlation Chart
The statistical analysis conducted on geographies consisting of 110,096,720 people shows a mild negative correlation between the proportion of Sudanese and median household income in the United States with a correlation coefficient (R) of -0.382 and weighted average of $78,529. Similarly, the statistical analysis conducted on geographies consisting of 199,784,563 people shows no correlation between the proportion of Immigrants from Ghana and median household income in the United States with a correlation coefficient (R) of 0.005 and weighted average of $81,489, a difference of 3.8%.
Median Household Income Correlation Summary
| Measurement | Sudanese | Immigrants from Ghana |
| Minimum | $28,750 | $34,375 |
| Maximum | $150,237 | $138,703 |
| Range | $121,487 | $104,328 |
| Mean | $71,874 | $81,173 |
| Median | $73,369 | $81,072 |
| Interquartile 25% (IQ1) | $61,639 | $64,873 |
| Interquartile 75% (IQ3) | $82,076 | $94,696 |
| Interquartile Range (IQR) | $20,437 | $29,822 |
| Standard Deviation (Sample) | $22,253 | $24,293 |
| Standard Deviation (Population) | $22,086 | $24,164 |
Similar Demographics by Median Household Income
Demographics Similar to Sudanese by Median Household Income
In terms of median household income, the demographic groups most similar to Sudanese are West Indian ($78,455, a difference of 0.090%), Immigrants from Burma/Myanmar ($78,682, a difference of 0.19%), Immigrants from Laos ($78,327, a difference of 0.26%), Central American ($78,803, a difference of 0.35%), and Inupiat ($78,841, a difference of 0.40%).
| Demographics | Rating | Rank | Median Household Income |
| Immigrants | Nonimmigrants | 2.6 /100 | #241 | Tragic $79,429 |
| Immigrants | Sudan | 2.1 /100 | #242 | Tragic $79,103 |
| Immigrants | Barbados | 1.9 /100 | #243 | Tragic $78,989 |
| Marshallese | 1.9 /100 | #244 | Tragic $78,930 |
| Inupiat | 1.8 /100 | #245 | Tragic $78,841 |
| Central Americans | 1.7 /100 | #246 | Tragic $78,803 |
| Immigrants | Burma/Myanmar | 1.6 /100 | #247 | Tragic $78,682 |
| Sudanese | 1.5 /100 | #248 | Tragic $78,529 |
| West Indians | 1.4 /100 | #249 | Tragic $78,455 |
| Immigrants | Laos | 1.3 /100 | #250 | Tragic $78,327 |
| Mexican American Indians | 1.2 /100 | #251 | Tragic $78,166 |
| Immigrants | West Indies | 1.0 /100 | #252 | Tragic $77,956 |
| Immigrants | St. Vincent and the Grenadines | 0.9 /100 | #253 | Tragic $77,690 |
| Sub-Saharan Africans | 0.8 /100 | #254 | Tragic $77,631 |
| Immigrants | Middle Africa | 0.8 /100 | #255 | Tragic $77,559 |
Demographics Similar to Immigrants from Ghana by Median Household Income
In terms of median household income, the demographic groups most similar to Immigrants from Ghana are Immigrants from Venezuela ($81,506, a difference of 0.020%), Nigerian ($81,725, a difference of 0.29%), Immigrants from Nigeria ($81,236, a difference of 0.31%), Immigrants from El Salvador ($81,213, a difference of 0.34%), and Malaysian ($81,064, a difference of 0.52%).
| Demographics | Rating | Rank | Median Household Income |
| Panamanians | 14.0 /100 | #214 | Poor $82,272 |
| Vietnamese | 13.8 /100 | #215 | Poor $82,248 |
| Yugoslavians | 13.3 /100 | #216 | Poor $82,186 |
| Ecuadorians | 12.5 /100 | #217 | Poor $82,070 |
| Whites/Caucasians | 12.2 /100 | #218 | Poor $82,029 |
| Nigerians | 10.3 /100 | #219 | Poor $81,725 |
| Immigrants | Venezuela | 9.0 /100 | #220 | Tragic $81,506 |
| Immigrants | Ghana | 9.0 /100 | #221 | Tragic $81,489 |
| Immigrants | Nigeria | 7.7 /100 | #222 | Tragic $81,236 |
| Immigrants | El Salvador | 7.6 /100 | #223 | Tragic $81,213 |
| Malaysians | 7.0 /100 | #224 | Tragic $81,064 |
| Scotch-Irish | 6.6 /100 | #225 | Tragic $80,972 |
| Immigrants | Panama | 6.2 /100 | #226 | Tragic $80,873 |
| Guyanese | 5.7 /100 | #227 | Tragic $80,734 |
| Immigrants | Bangladesh | 5.7 /100 | #228 | Tragic $80,722 |