Shoshone vs Immigrants from Ghana Median Household Income
COMPARE
Shoshone
Immigrants from Ghana
Median Household Income
Median Household Income Comparison
Shoshone
Immigrants from Ghana
$72,660
MEDIAN HOUSEHOLD INCOME
0.0/ 100
METRIC RATING
302nd/ 347
METRIC RANK
$81,489
MEDIAN HOUSEHOLD INCOME
9.0/ 100
METRIC RATING
221st/ 347
METRIC RANK
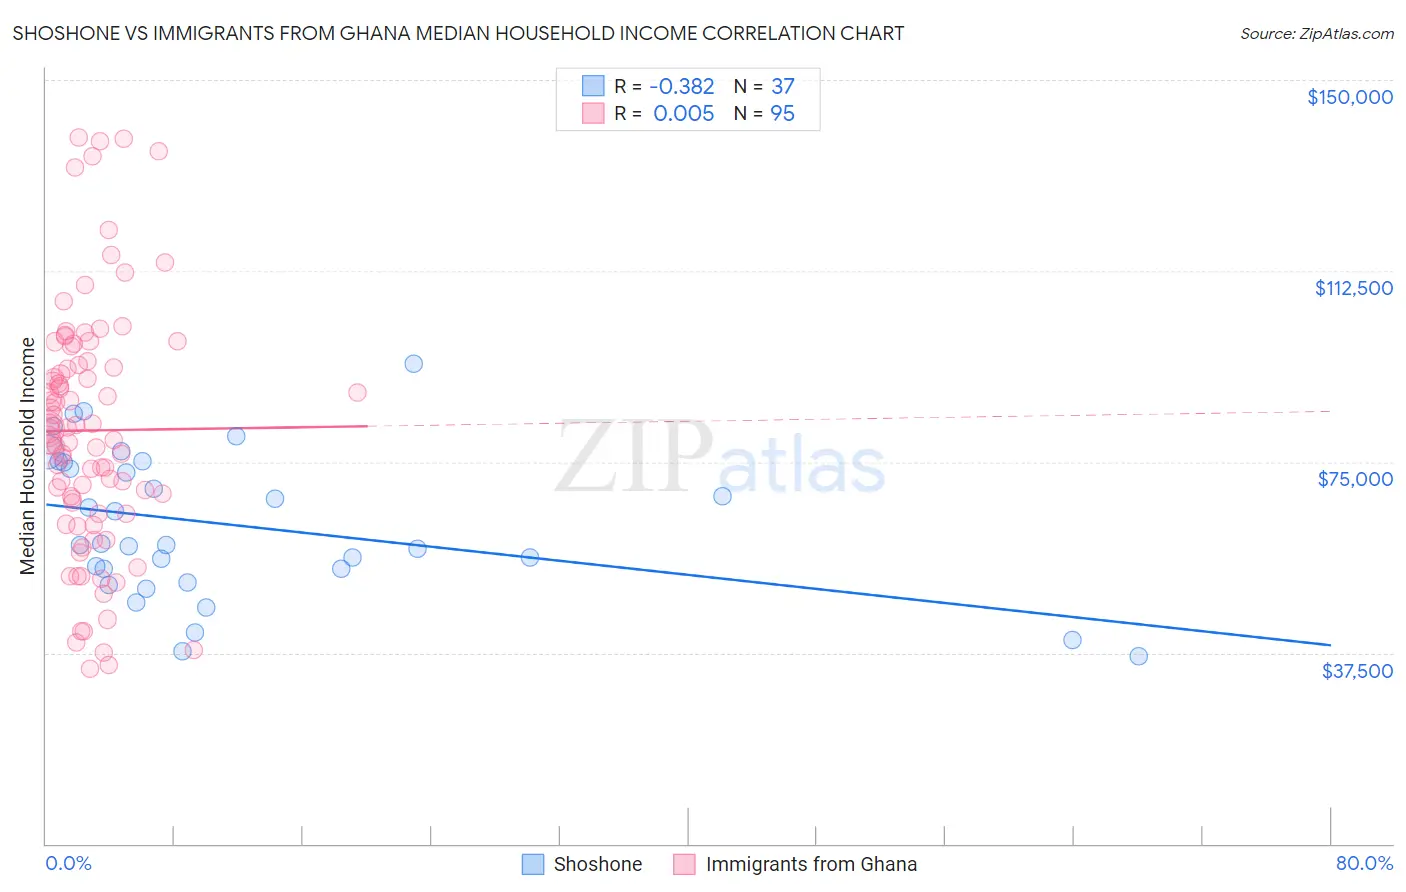
Shoshone vs Immigrants from Ghana Median Household Income Correlation Chart
The statistical analysis conducted on geographies consisting of 66,612,449 people shows a mild negative correlation between the proportion of Shoshone and median household income in the United States with a correlation coefficient (R) of -0.382 and weighted average of $72,660. Similarly, the statistical analysis conducted on geographies consisting of 199,784,563 people shows no correlation between the proportion of Immigrants from Ghana and median household income in the United States with a correlation coefficient (R) of 0.005 and weighted average of $81,489, a difference of 12.1%.
Median Household Income Correlation Summary
| Measurement | Shoshone | Immigrants from Ghana |
| Minimum | $36,823 | $34,375 |
| Maximum | $94,375 | $138,703 |
| Range | $57,552 | $104,328 |
| Mean | $62,559 | $81,173 |
| Median | $58,750 | $81,072 |
| Interquartile 25% (IQ1) | $52,629 | $64,873 |
| Interquartile 75% (IQ3) | $75,002 | $94,696 |
| Interquartile Range (IQR) | $22,372 | $29,822 |
| Standard Deviation (Sample) | $14,416 | $24,293 |
| Standard Deviation (Population) | $14,219 | $24,164 |
Similar Demographics by Median Household Income
Demographics Similar to Shoshone by Median Household Income
In terms of median household income, the demographic groups most similar to Shoshone are African ($72,650, a difference of 0.010%), Cherokee ($72,682, a difference of 0.030%), Immigrants from Haiti ($72,599, a difference of 0.080%), Honduran ($72,588, a difference of 0.10%), and Potawatomi ($72,576, a difference of 0.12%).
| Demographics | Rating | Rank | Median Household Income |
| Cubans | 0.1 /100 | #295 | Tragic $73,392 |
| Haitians | 0.1 /100 | #296 | Tragic $73,306 |
| Immigrants | Mexico | 0.0 /100 | #297 | Tragic $73,160 |
| Paiute | 0.0 /100 | #298 | Tragic $72,959 |
| Indonesians | 0.0 /100 | #299 | Tragic $72,856 |
| Immigrants | Dominica | 0.0 /100 | #300 | Tragic $72,760 |
| Cherokee | 0.0 /100 | #301 | Tragic $72,682 |
| Shoshone | 0.0 /100 | #302 | Tragic $72,660 |
| Africans | 0.0 /100 | #303 | Tragic $72,650 |
| Immigrants | Haiti | 0.0 /100 | #304 | Tragic $72,599 |
| Hondurans | 0.0 /100 | #305 | Tragic $72,588 |
| Potawatomi | 0.0 /100 | #306 | Tragic $72,576 |
| Ute | 0.0 /100 | #307 | Tragic $72,402 |
| Yakama | 0.0 /100 | #308 | Tragic $72,225 |
| Immigrants | Caribbean | 0.0 /100 | #309 | Tragic $71,860 |
Demographics Similar to Immigrants from Ghana by Median Household Income
In terms of median household income, the demographic groups most similar to Immigrants from Ghana are Immigrants from Venezuela ($81,506, a difference of 0.020%), Nigerian ($81,725, a difference of 0.29%), Immigrants from Nigeria ($81,236, a difference of 0.31%), Immigrants from El Salvador ($81,213, a difference of 0.34%), and Malaysian ($81,064, a difference of 0.52%).
| Demographics | Rating | Rank | Median Household Income |
| Panamanians | 14.0 /100 | #214 | Poor $82,272 |
| Vietnamese | 13.8 /100 | #215 | Poor $82,248 |
| Yugoslavians | 13.3 /100 | #216 | Poor $82,186 |
| Ecuadorians | 12.5 /100 | #217 | Poor $82,070 |
| Whites/Caucasians | 12.2 /100 | #218 | Poor $82,029 |
| Nigerians | 10.3 /100 | #219 | Poor $81,725 |
| Immigrants | Venezuela | 9.0 /100 | #220 | Tragic $81,506 |
| Immigrants | Ghana | 9.0 /100 | #221 | Tragic $81,489 |
| Immigrants | Nigeria | 7.7 /100 | #222 | Tragic $81,236 |
| Immigrants | El Salvador | 7.6 /100 | #223 | Tragic $81,213 |
| Malaysians | 7.0 /100 | #224 | Tragic $81,064 |
| Scotch-Irish | 6.6 /100 | #225 | Tragic $80,972 |
| Immigrants | Panama | 6.2 /100 | #226 | Tragic $80,873 |
| Guyanese | 5.7 /100 | #227 | Tragic $80,734 |
| Immigrants | Bangladesh | 5.7 /100 | #228 | Tragic $80,722 |