Somali vs U.S. Virgin Islander Median Family Income
COMPARE
Somali
U.S. Virgin Islander
Median Family Income
Median Family Income Comparison
Somalis
U.S. Virgin Islanders
$94,085
MEDIAN FAMILY INCOME
1.2/ 100
METRIC RATING
240th/ 347
METRIC RANK
$85,294
MEDIAN FAMILY INCOME
0.0/ 100
METRIC RATING
308th/ 347
METRIC RANK
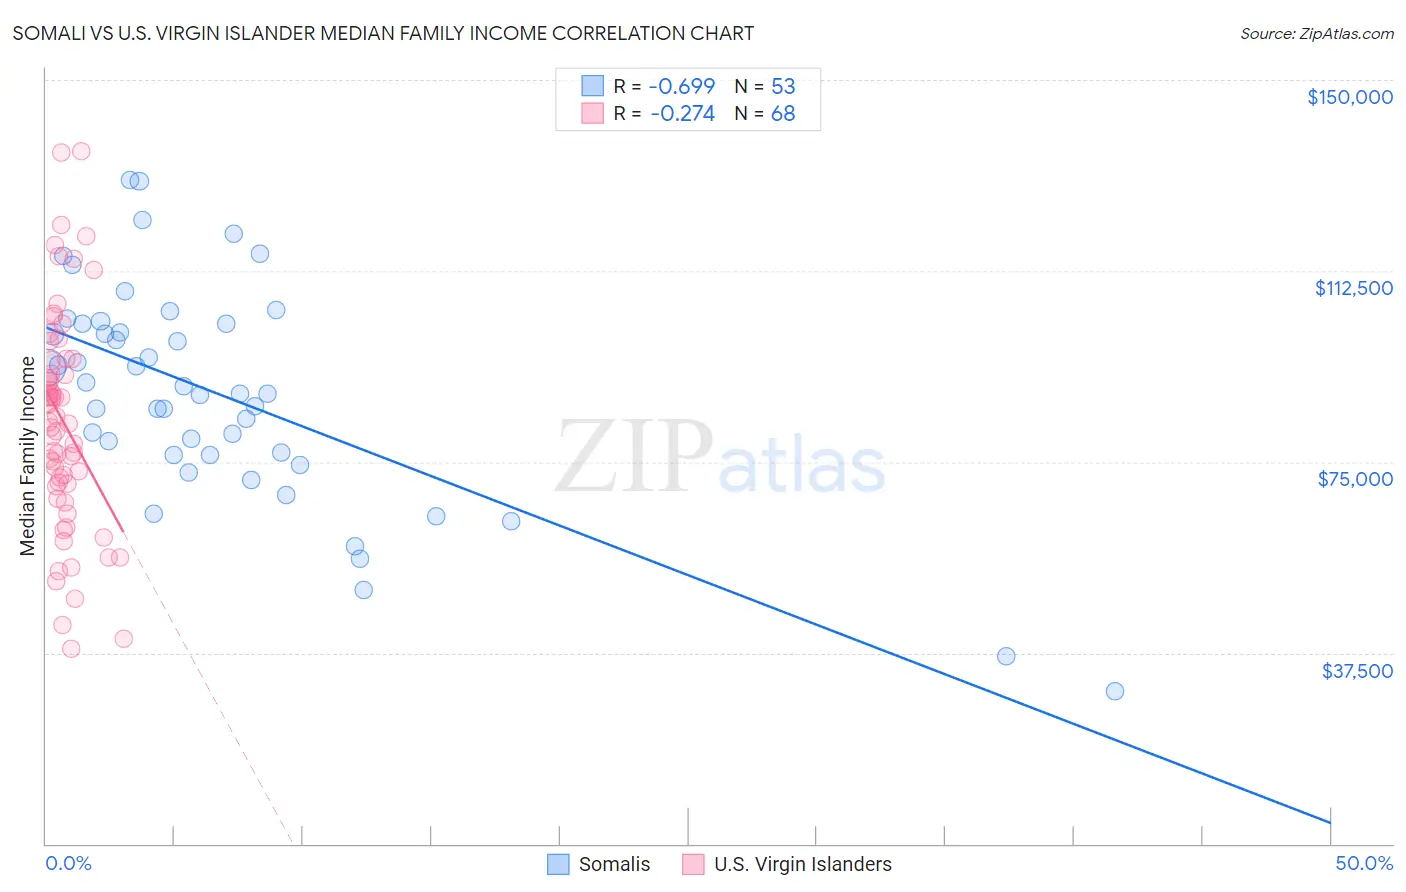
Somali vs U.S. Virgin Islander Median Family Income Correlation Chart
The statistical analysis conducted on geographies consisting of 99,278,232 people shows a significant negative correlation between the proportion of Somalis and median family income in the United States with a correlation coefficient (R) of -0.699 and weighted average of $94,085. Similarly, the statistical analysis conducted on geographies consisting of 87,505,006 people shows a weak negative correlation between the proportion of U.S. Virgin Islanders and median family income in the United States with a correlation coefficient (R) of -0.274 and weighted average of $85,294, a difference of 10.3%.
Median Family Income Correlation Summary
| Measurement | Somali | U.S. Virgin Islander |
| Minimum | $29,978 | $38,346 |
| Maximum | $130,246 | $136,000 |
| Range | $100,268 | $97,654 |
| Mean | $88,236 | $82,878 |
| Median | $88,476 | $82,757 |
| Interquartile 25% (IQ1) | $76,386 | $70,515 |
| Interquartile 75% (IQ3) | $102,172 | $95,033 |
| Interquartile Range (IQR) | $25,786 | $24,518 |
| Standard Deviation (Sample) | $21,250 | $21,454 |
| Standard Deviation (Population) | $21,049 | $21,296 |
Similar Demographics by Median Family Income
Demographics Similar to Somalis by Median Family Income
In terms of median family income, the demographic groups most similar to Somalis are Salvadoran ($94,109, a difference of 0.030%), Nepalese ($94,153, a difference of 0.070%), Immigrants from Trinidad and Tobago ($93,988, a difference of 0.10%), Barbadian ($93,919, a difference of 0.18%), and German Russian ($93,858, a difference of 0.24%).
| Demographics | Rating | Rank | Median Family Income |
| Immigrants | Bangladesh | 1.6 /100 | #233 | Tragic $94,665 |
| Immigrants | Western Africa | 1.6 /100 | #234 | Tragic $94,638 |
| Immigrants | Burma/Myanmar | 1.5 /100 | #235 | Tragic $94,472 |
| Trinidadians and Tobagonians | 1.5 /100 | #236 | Tragic $94,466 |
| Alaskan Athabascans | 1.5 /100 | #237 | Tragic $94,429 |
| Nepalese | 1.3 /100 | #238 | Tragic $94,153 |
| Salvadorans | 1.2 /100 | #239 | Tragic $94,109 |
| Somalis | 1.2 /100 | #240 | Tragic $94,085 |
| Immigrants | Trinidad and Tobago | 1.2 /100 | #241 | Tragic $93,988 |
| Barbadians | 1.1 /100 | #242 | Tragic $93,919 |
| German Russians | 1.1 /100 | #243 | Tragic $93,858 |
| Sub-Saharan Africans | 1.0 /100 | #244 | Tragic $93,748 |
| Immigrants | Middle Africa | 1.0 /100 | #245 | Tragic $93,593 |
| Guyanese | 0.9 /100 | #246 | Tragic $93,373 |
| Immigrants | Senegal | 0.7 /100 | #247 | Tragic $92,912 |
Demographics Similar to U.S. Virgin Islanders by Median Family Income
In terms of median family income, the demographic groups most similar to U.S. Virgin Islanders are Chickasaw ($85,356, a difference of 0.070%), Haitian ($85,218, a difference of 0.090%), Paiute ($85,414, a difference of 0.14%), Immigrants from Dominica ($85,411, a difference of 0.14%), and Immigrants from Central America ($85,050, a difference of 0.29%).
| Demographics | Rating | Rank | Median Family Income |
| Colville | 0.0 /100 | #301 | Tragic $85,792 |
| Spanish American Indians | 0.0 /100 | #302 | Tragic $85,728 |
| Hispanics or Latinos | 0.0 /100 | #303 | Tragic $85,647 |
| Mexicans | 0.0 /100 | #304 | Tragic $85,618 |
| Paiute | 0.0 /100 | #305 | Tragic $85,414 |
| Immigrants | Dominica | 0.0 /100 | #306 | Tragic $85,411 |
| Chickasaw | 0.0 /100 | #307 | Tragic $85,356 |
| U.S. Virgin Islanders | 0.0 /100 | #308 | Tragic $85,294 |
| Haitians | 0.0 /100 | #309 | Tragic $85,218 |
| Immigrants | Central America | 0.0 /100 | #310 | Tragic $85,050 |
| Hondurans | 0.0 /100 | #311 | Tragic $85,004 |
| Cubans | 0.0 /100 | #312 | Tragic $84,981 |
| Choctaw | 0.0 /100 | #313 | Tragic $84,835 |
| Immigrants | Bahamas | 0.0 /100 | #314 | Tragic $84,732 |
| Apache | 0.0 /100 | #315 | Tragic $84,451 |