Vietnamese vs Yugoslavian Median Male Earnings
COMPARE
Vietnamese
Yugoslavian
Median Male Earnings
Median Male Earnings Comparison
Vietnamese
Yugoslavians
$52,525
MEDIAN MALE EARNINGS
12.7/ 100
METRIC RATING
207th/ 347
METRIC RANK
$53,967
MEDIAN MALE EARNINGS
37.4/ 100
METRIC RATING
182nd/ 347
METRIC RANK
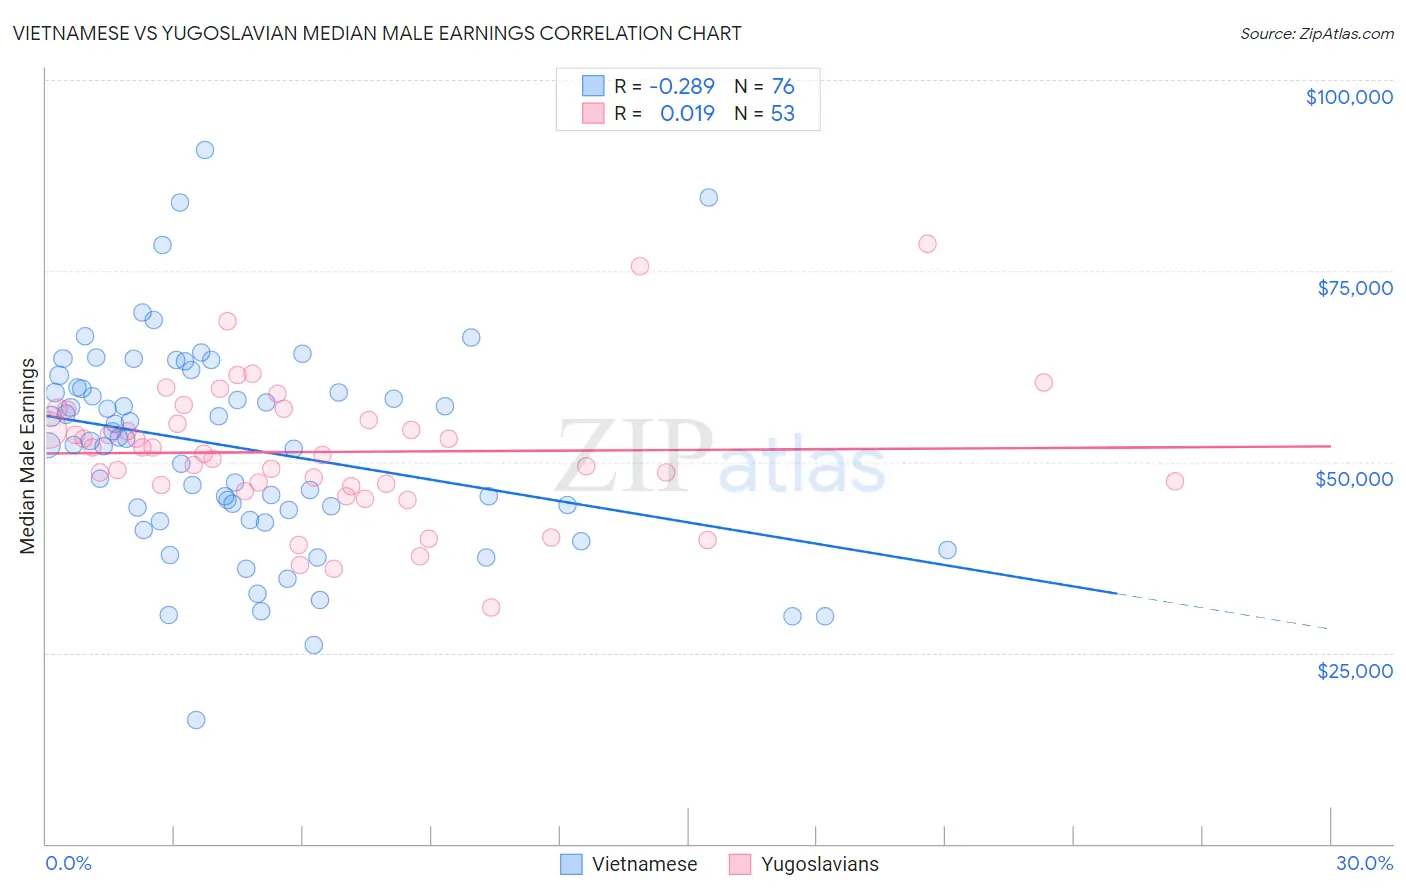
Vietnamese vs Yugoslavian Median Male Earnings Correlation Chart
The statistical analysis conducted on geographies consisting of 170,734,633 people shows a weak negative correlation between the proportion of Vietnamese and median male earnings in the United States with a correlation coefficient (R) of -0.289 and weighted average of $52,525. Similarly, the statistical analysis conducted on geographies consisting of 285,670,858 people shows no correlation between the proportion of Yugoslavians and median male earnings in the United States with a correlation coefficient (R) of 0.019 and weighted average of $53,967, a difference of 2.8%.
Median Male Earnings Correlation Summary
| Measurement | Vietnamese | Yugoslavian |
| Minimum | $16,146 | $30,961 |
| Maximum | $90,827 | $78,594 |
| Range | $74,681 | $47,633 |
| Mean | $51,791 | $51,302 |
| Median | $52,846 | $51,102 |
| Interquartile 25% (IQ1) | $43,003 | $46,894 |
| Interquartile 75% (IQ3) | $59,635 | $56,167 |
| Interquartile Range (IQR) | $16,633 | $9,274 |
| Standard Deviation (Sample) | $13,801 | $8,961 |
| Standard Deviation (Population) | $13,710 | $8,876 |
Similar Demographics by Median Male Earnings
Demographics Similar to Vietnamese by Median Male Earnings
In terms of median male earnings, the demographic groups most similar to Vietnamese are Venezuelan ($52,510, a difference of 0.030%), Bermudan ($52,465, a difference of 0.11%), Delaware ($52,412, a difference of 0.22%), Tlingit-Haida ($52,409, a difference of 0.22%), and Immigrants from Iraq ($52,681, a difference of 0.30%).
| Demographics | Rating | Rank | Median Male Earnings |
| Immigrants | Thailand | 17.5 /100 | #200 | Poor $52,908 |
| Immigrants | Bosnia and Herzegovina | 16.9 /100 | #201 | Poor $52,869 |
| Immigrants | Uruguay | 16.8 /100 | #202 | Poor $52,860 |
| Panamanians | 16.5 /100 | #203 | Poor $52,835 |
| Ghanaians | 16.1 /100 | #204 | Poor $52,810 |
| Immigrants | Colombia | 15.0 /100 | #205 | Poor $52,725 |
| Immigrants | Iraq | 14.5 /100 | #206 | Poor $52,681 |
| Vietnamese | 12.7 /100 | #207 | Poor $52,525 |
| Venezuelans | 12.5 /100 | #208 | Poor $52,510 |
| Bermudans | 12.1 /100 | #209 | Poor $52,465 |
| Delaware | 11.5 /100 | #210 | Poor $52,412 |
| Tlingit-Haida | 11.5 /100 | #211 | Poor $52,409 |
| Cajuns | 10.7 /100 | #212 | Poor $52,325 |
| Native Hawaiians | 10.5 /100 | #213 | Poor $52,306 |
| Immigrants | Nonimmigrants | 9.3 /100 | #214 | Tragic $52,170 |
Demographics Similar to Yugoslavians by Median Male Earnings
In terms of median male earnings, the demographic groups most similar to Yugoslavians are Immigrants from South America ($53,962, a difference of 0.010%), White/Caucasian ($53,925, a difference of 0.080%), Immigrants from Sierra Leone ($53,905, a difference of 0.11%), Colombian ($53,832, a difference of 0.25%), and Immigrants ($54,168, a difference of 0.37%).
| Demographics | Rating | Rank | Median Male Earnings |
| Dutch | 48.0 /100 | #175 | Average $54,410 |
| Spaniards | 47.8 /100 | #176 | Average $54,401 |
| Costa Ricans | 44.8 /100 | #177 | Average $54,279 |
| Sierra Leoneans | 44.8 /100 | #178 | Average $54,279 |
| Celtics | 43.9 /100 | #179 | Average $54,242 |
| Iraqis | 42.5 /100 | #180 | Average $54,182 |
| Immigrants | Immigrants | 42.1 /100 | #181 | Average $54,168 |
| Yugoslavians | 37.4 /100 | #182 | Fair $53,967 |
| Immigrants | South America | 37.3 /100 | #183 | Fair $53,962 |
| Whites/Caucasians | 36.5 /100 | #184 | Fair $53,925 |
| Immigrants | Sierra Leone | 36.0 /100 | #185 | Fair $53,905 |
| Colombians | 34.4 /100 | #186 | Fair $53,832 |
| Immigrants | Eritrea | 31.8 /100 | #187 | Fair $53,715 |
| Immigrants | Eastern Africa | 31.8 /100 | #188 | Fair $53,713 |
| Puget Sound Salish | 31.6 /100 | #189 | Fair $53,704 |