Nepalese vs Maltese Median Male Earnings
COMPARE
Nepalese
Maltese
Median Male Earnings
Median Male Earnings Comparison
Nepalese
Maltese
$49,458
MEDIAN MALE EARNINGS
0.7/ 100
METRIC RATING
259th/ 347
METRIC RANK
$62,953
MEDIAN MALE EARNINGS
100.0/ 100
METRIC RATING
38th/ 347
METRIC RANK
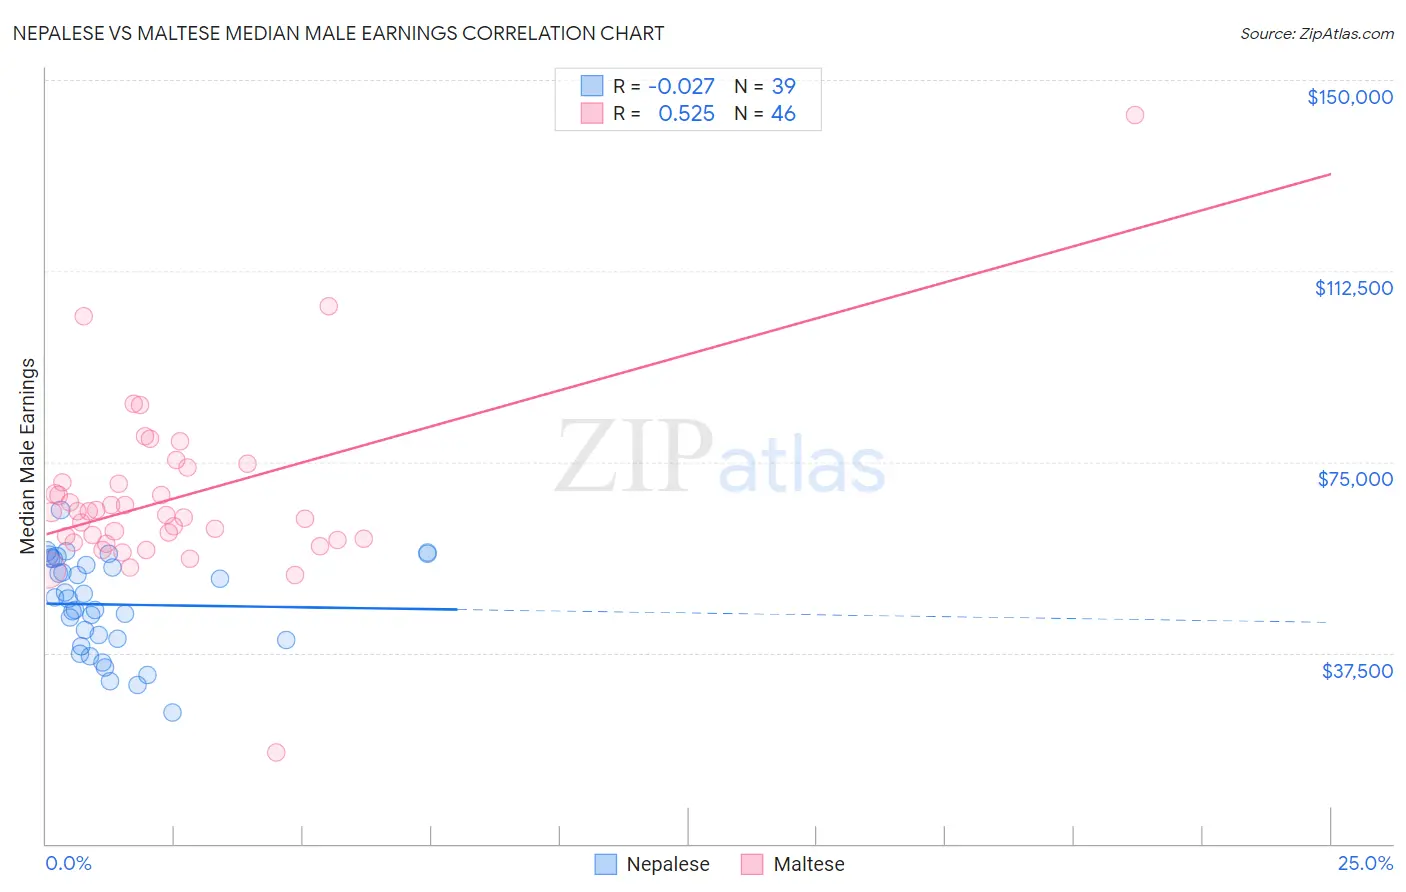
Nepalese vs Maltese Median Male Earnings Correlation Chart
The statistical analysis conducted on geographies consisting of 24,431,712 people shows no correlation between the proportion of Nepalese and median male earnings in the United States with a correlation coefficient (R) of -0.027 and weighted average of $49,458. Similarly, the statistical analysis conducted on geographies consisting of 126,470,445 people shows a substantial positive correlation between the proportion of Maltese and median male earnings in the United States with a correlation coefficient (R) of 0.525 and weighted average of $62,953, a difference of 27.3%.
Median Male Earnings Correlation Summary
| Measurement | Nepalese | Maltese |
| Minimum | $25,893 | $17,917 |
| Maximum | $65,607 | $143,125 |
| Range | $39,714 | $125,208 |
| Mean | $46,984 | $67,890 |
| Median | $48,060 | $64,879 |
| Interquartile 25% (IQ1) | $40,000 | $59,600 |
| Interquartile 75% (IQ3) | $56,086 | $71,008 |
| Interquartile Range (IQR) | $16,086 | $11,408 |
| Standard Deviation (Sample) | $9,323 | $17,590 |
| Standard Deviation (Population) | $9,202 | $17,397 |
Similar Demographics by Median Male Earnings
Demographics Similar to Nepalese by Median Male Earnings
In terms of median male earnings, the demographic groups most similar to Nepalese are Cree ($49,497, a difference of 0.080%), Iroquois ($49,374, a difference of 0.17%), Liberian ($49,318, a difference of 0.28%), British West Indian ($49,636, a difference of 0.36%), and Immigrants from West Indies ($49,271, a difference of 0.38%).
| Demographics | Rating | Rank | Median Male Earnings |
| Immigrants | Cabo Verde | 1.2 /100 | #252 | Tragic $50,009 |
| German Russians | 1.1 /100 | #253 | Tragic $49,924 |
| Senegalese | 1.0 /100 | #254 | Tragic $49,774 |
| Alaskan Athabascans | 0.9 /100 | #255 | Tragic $49,748 |
| Alaska Natives | 0.9 /100 | #256 | Tragic $49,711 |
| British West Indians | 0.8 /100 | #257 | Tragic $49,636 |
| Cree | 0.7 /100 | #258 | Tragic $49,497 |
| Nepalese | 0.7 /100 | #259 | Tragic $49,458 |
| Iroquois | 0.7 /100 | #260 | Tragic $49,374 |
| Liberians | 0.6 /100 | #261 | Tragic $49,318 |
| Immigrants | West Indies | 0.6 /100 | #262 | Tragic $49,271 |
| Nicaraguans | 0.6 /100 | #263 | Tragic $49,215 |
| Immigrants | Middle Africa | 0.6 /100 | #264 | Tragic $49,201 |
| Immigrants | Laos | 0.6 /100 | #265 | Tragic $49,190 |
| Somalis | 0.5 /100 | #266 | Tragic $49,025 |
Demographics Similar to Maltese by Median Male Earnings
In terms of median male earnings, the demographic groups most similar to Maltese are Immigrants from South Africa ($62,899, a difference of 0.090%), Australian ($62,857, a difference of 0.15%), Immigrants from Sri Lanka ($63,099, a difference of 0.23%), Immigrants from Turkey ($62,728, a difference of 0.36%), and Immigrants from Greece ($62,689, a difference of 0.42%).
| Demographics | Rating | Rank | Median Male Earnings |
| Latvians | 100.0 /100 | #31 | Exceptional $63,498 |
| Soviet Union | 100.0 /100 | #32 | Exceptional $63,382 |
| Immigrants | Lithuania | 100.0 /100 | #33 | Exceptional $63,346 |
| Immigrants | Russia | 100.0 /100 | #34 | Exceptional $63,326 |
| Immigrants | Asia | 100.0 /100 | #35 | Exceptional $63,240 |
| Israelis | 100.0 /100 | #36 | Exceptional $63,228 |
| Immigrants | Sri Lanka | 100.0 /100 | #37 | Exceptional $63,099 |
| Maltese | 100.0 /100 | #38 | Exceptional $62,953 |
| Immigrants | South Africa | 100.0 /100 | #39 | Exceptional $62,899 |
| Australians | 100.0 /100 | #40 | Exceptional $62,857 |
| Immigrants | Turkey | 100.0 /100 | #41 | Exceptional $62,728 |
| Immigrants | Greece | 100.0 /100 | #42 | Exceptional $62,689 |
| Immigrants | Belarus | 100.0 /100 | #43 | Exceptional $62,658 |
| Cambodians | 100.0 /100 | #44 | Exceptional $62,516 |
| Bulgarians | 100.0 /100 | #45 | Exceptional $62,378 |