Senegalese vs Immigrants from Uganda Per Capita Income
COMPARE
Senegalese
Immigrants from Uganda
Per Capita Income
Per Capita Income Comparison
Senegalese
Immigrants from Uganda
$41,000
PER CAPITA INCOME
4.8/ 100
METRIC RATING
231st/ 347
METRIC RANK
$45,043
PER CAPITA INCOME
82.5/ 100
METRIC RATING
143rd/ 347
METRIC RANK
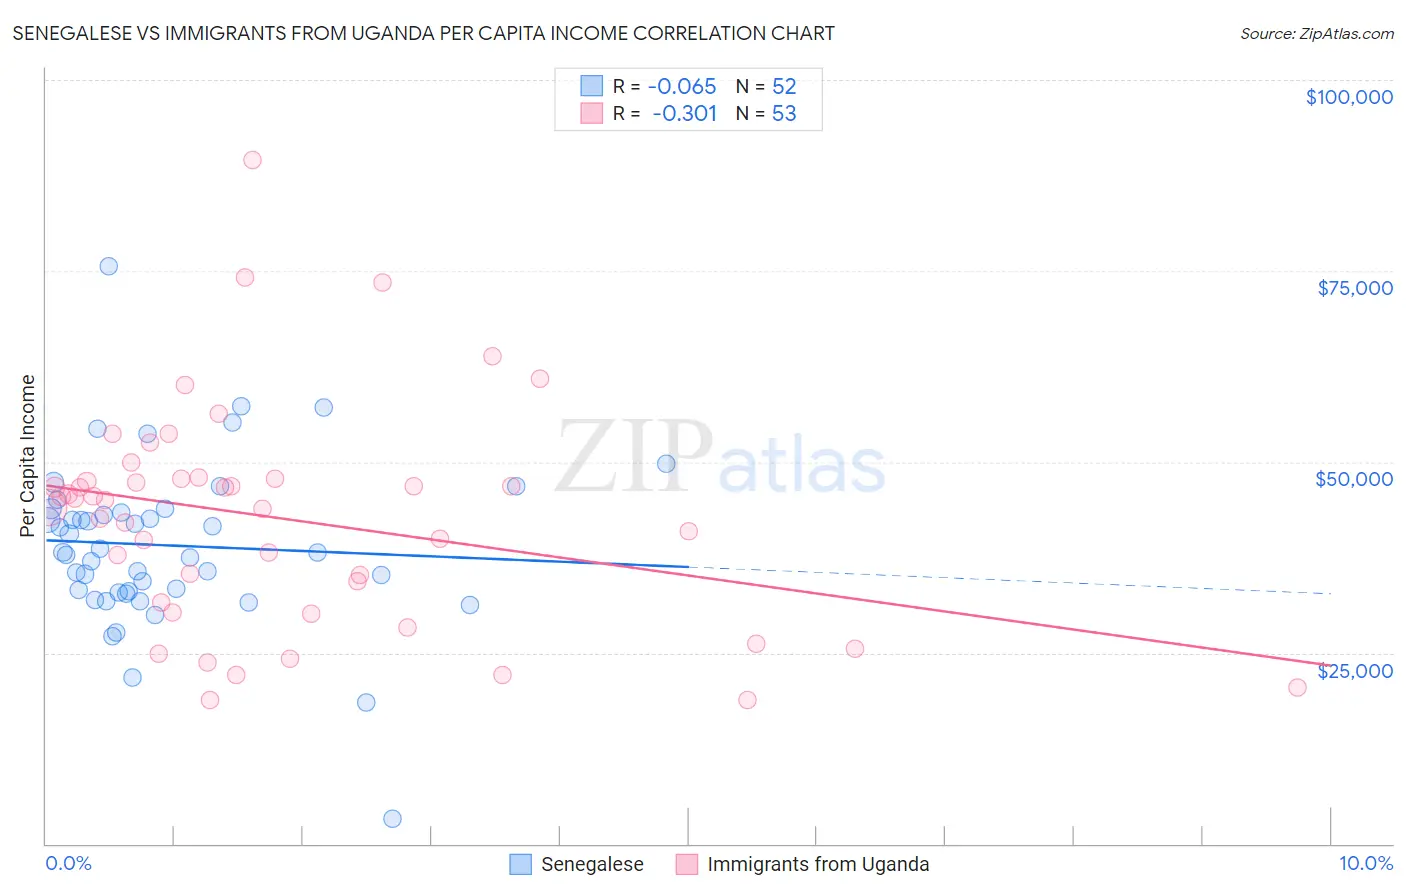
Senegalese vs Immigrants from Uganda Per Capita Income Correlation Chart
The statistical analysis conducted on geographies consisting of 78,107,792 people shows a slight negative correlation between the proportion of Senegalese and per capita income in the United States with a correlation coefficient (R) of -0.065 and weighted average of $41,000. Similarly, the statistical analysis conducted on geographies consisting of 125,982,219 people shows a mild negative correlation between the proportion of Immigrants from Uganda and per capita income in the United States with a correlation coefficient (R) of -0.301 and weighted average of $45,043, a difference of 9.9%.
Per Capita Income Correlation Summary
| Measurement | Senegalese | Immigrants from Uganda |
| Minimum | $3,219 | $18,741 |
| Maximum | $75,539 | $89,561 |
| Range | $72,320 | $70,820 |
| Mean | $39,064 | $42,540 |
| Median | $38,147 | $45,016 |
| Interquartile 25% (IQ1) | $33,014 | $30,934 |
| Interquartile 75% (IQ3) | $43,632 | $47,740 |
| Interquartile Range (IQR) | $10,618 | $16,806 |
| Standard Deviation (Sample) | $10,948 | $14,536 |
| Standard Deviation (Population) | $10,843 | $14,398 |
Similar Demographics by Per Capita Income
Demographics Similar to Senegalese by Per Capita Income
In terms of per capita income, the demographic groups most similar to Senegalese are Native Hawaiian ($41,017, a difference of 0.040%), Nigerian ($41,026, a difference of 0.060%), Guyanese ($40,949, a difference of 0.12%), Immigrants from Grenada ($41,123, a difference of 0.30%), and Immigrants from Ghana ($41,131, a difference of 0.32%).
| Demographics | Rating | Rank | Per Capita Income |
| Immigrants | St. Vincent and the Grenadines | 6.4 /100 | #224 | Tragic $41,270 |
| West Indians | 6.0 /100 | #225 | Tragic $41,217 |
| Immigrants | Ecuador | 5.9 /100 | #226 | Tragic $41,195 |
| Immigrants | Ghana | 5.5 /100 | #227 | Tragic $41,131 |
| Immigrants | Grenada | 5.5 /100 | #228 | Tragic $41,123 |
| Nigerians | 4.9 /100 | #229 | Tragic $41,026 |
| Native Hawaiians | 4.9 /100 | #230 | Tragic $41,017 |
| Senegalese | 4.8 /100 | #231 | Tragic $41,000 |
| Guyanese | 4.5 /100 | #232 | Tragic $40,949 |
| Delaware | 3.8 /100 | #233 | Tragic $40,778 |
| Immigrants | West Indies | 3.7 /100 | #234 | Tragic $40,763 |
| Immigrants | Guyana | 3.6 /100 | #235 | Tragic $40,742 |
| Immigrants | Nonimmigrants | 3.4 /100 | #236 | Tragic $40,669 |
| Immigrants | Cambodia | 2.6 /100 | #237 | Tragic $40,434 |
| Somalis | 2.4 /100 | #238 | Tragic $40,367 |
Demographics Similar to Immigrants from Uganda by Per Capita Income
In terms of per capita income, the demographic groups most similar to Immigrants from Uganda are Slavic ($45,049, a difference of 0.010%), Ugandan ($45,047, a difference of 0.010%), Immigrants from Jordan ($45,066, a difference of 0.050%), Basque ($45,086, a difference of 0.10%), and Icelander ($44,987, a difference of 0.12%).
| Demographics | Rating | Rank | Per Capita Income |
| Immigrants | Oceania | 85.2 /100 | #136 | Excellent $45,220 |
| Immigrants | Syria | 85.2 /100 | #137 | Excellent $45,218 |
| Assyrians/Chaldeans/Syriacs | 84.8 /100 | #138 | Excellent $45,195 |
| Basques | 83.2 /100 | #139 | Excellent $45,086 |
| Immigrants | Jordan | 82.9 /100 | #140 | Excellent $45,066 |
| Slavs | 82.6 /100 | #141 | Excellent $45,049 |
| Ugandans | 82.6 /100 | #142 | Excellent $45,047 |
| Immigrants | Uganda | 82.5 /100 | #143 | Excellent $45,043 |
| Icelanders | 81.6 /100 | #144 | Excellent $44,987 |
| Immigrants | Afghanistan | 78.0 /100 | #145 | Good $44,790 |
| Irish | 75.8 /100 | #146 | Good $44,679 |
| Czechs | 74.1 /100 | #147 | Good $44,595 |
| Immigrants | Armenia | 73.1 /100 | #148 | Good $44,552 |
| Koreans | 72.5 /100 | #149 | Good $44,522 |
| Immigrants | Eritrea | 72.1 /100 | #150 | Good $44,509 |