Creek vs Immigrants from Uganda Per Capita Income
COMPARE
Creek
Immigrants from Uganda
Per Capita Income
Per Capita Income Comparison
Creek
Immigrants from Uganda
$35,546
PER CAPITA INCOME
0.0/ 100
METRIC RATING
322nd/ 347
METRIC RANK
$45,043
PER CAPITA INCOME
82.5/ 100
METRIC RATING
143rd/ 347
METRIC RANK
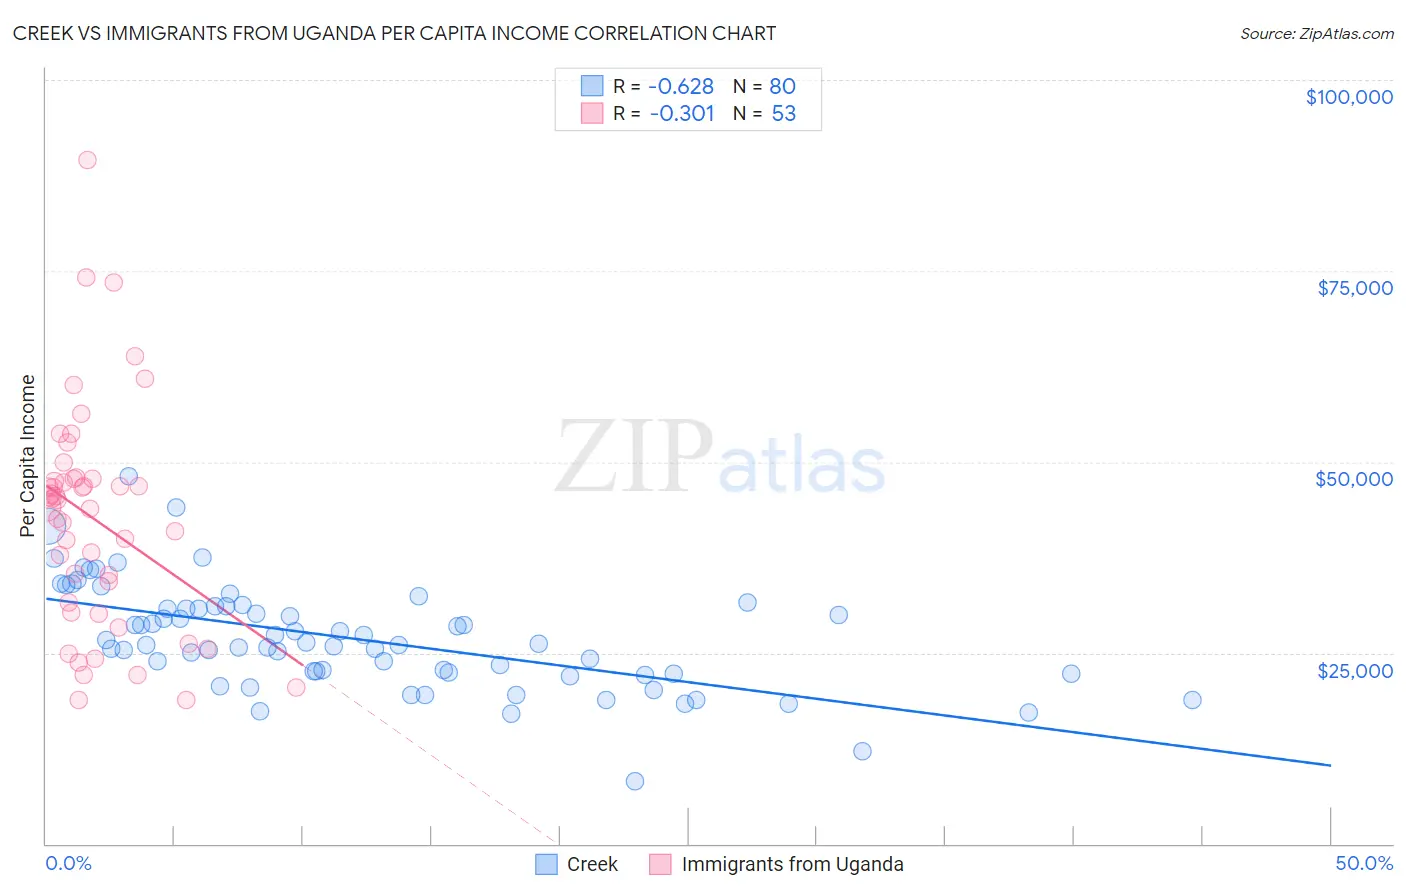
Creek vs Immigrants from Uganda Per Capita Income Correlation Chart
The statistical analysis conducted on geographies consisting of 178,484,884 people shows a significant negative correlation between the proportion of Creek and per capita income in the United States with a correlation coefficient (R) of -0.628 and weighted average of $35,546. Similarly, the statistical analysis conducted on geographies consisting of 125,982,219 people shows a mild negative correlation between the proportion of Immigrants from Uganda and per capita income in the United States with a correlation coefficient (R) of -0.301 and weighted average of $45,043, a difference of 26.7%.
Per Capita Income Correlation Summary
| Measurement | Creek | Immigrants from Uganda |
| Minimum | $8,185 | $18,741 |
| Maximum | $48,038 | $89,561 |
| Range | $39,853 | $70,820 |
| Mean | $26,882 | $42,540 |
| Median | $26,137 | $45,016 |
| Interquartile 25% (IQ1) | $22,339 | $30,934 |
| Interquartile 75% (IQ3) | $30,941 | $47,740 |
| Interquartile Range (IQR) | $8,603 | $16,806 |
| Standard Deviation (Sample) | $6,895 | $14,536 |
| Standard Deviation (Population) | $6,852 | $14,398 |
Similar Demographics by Per Capita Income
Demographics Similar to Creek by Per Capita Income
In terms of per capita income, the demographic groups most similar to Creek are Black/African American ($35,564, a difference of 0.050%), Hispanic or Latino ($35,688, a difference of 0.40%), Immigrants from Congo ($35,720, a difference of 0.49%), Cheyenne ($35,276, a difference of 0.76%), and Bangladeshi ($35,897, a difference of 0.99%).
| Demographics | Rating | Rank | Per Capita Income |
| Yaqui | 0.0 /100 | #315 | Tragic $36,112 |
| Choctaw | 0.0 /100 | #316 | Tragic $35,999 |
| Dutch West Indians | 0.0 /100 | #317 | Tragic $35,922 |
| Bangladeshis | 0.0 /100 | #318 | Tragic $35,897 |
| Immigrants | Congo | 0.0 /100 | #319 | Tragic $35,720 |
| Hispanics or Latinos | 0.0 /100 | #320 | Tragic $35,688 |
| Blacks/African Americans | 0.0 /100 | #321 | Tragic $35,564 |
| Creek | 0.0 /100 | #322 | Tragic $35,546 |
| Cheyenne | 0.0 /100 | #323 | Tragic $35,276 |
| Kiowa | 0.0 /100 | #324 | Tragic $35,102 |
| Immigrants | Central America | 0.0 /100 | #325 | Tragic $34,974 |
| Immigrants | Cuba | 0.0 /100 | #326 | Tragic $34,910 |
| Apache | 0.0 /100 | #327 | Tragic $34,886 |
| Menominee | 0.0 /100 | #328 | Tragic $34,578 |
| Mexicans | 0.0 /100 | #329 | Tragic $34,559 |
Demographics Similar to Immigrants from Uganda by Per Capita Income
In terms of per capita income, the demographic groups most similar to Immigrants from Uganda are Slavic ($45,049, a difference of 0.010%), Ugandan ($45,047, a difference of 0.010%), Immigrants from Jordan ($45,066, a difference of 0.050%), Basque ($45,086, a difference of 0.10%), and Icelander ($44,987, a difference of 0.12%).
| Demographics | Rating | Rank | Per Capita Income |
| Immigrants | Oceania | 85.2 /100 | #136 | Excellent $45,220 |
| Immigrants | Syria | 85.2 /100 | #137 | Excellent $45,218 |
| Assyrians/Chaldeans/Syriacs | 84.8 /100 | #138 | Excellent $45,195 |
| Basques | 83.2 /100 | #139 | Excellent $45,086 |
| Immigrants | Jordan | 82.9 /100 | #140 | Excellent $45,066 |
| Slavs | 82.6 /100 | #141 | Excellent $45,049 |
| Ugandans | 82.6 /100 | #142 | Excellent $45,047 |
| Immigrants | Uganda | 82.5 /100 | #143 | Excellent $45,043 |
| Icelanders | 81.6 /100 | #144 | Excellent $44,987 |
| Immigrants | Afghanistan | 78.0 /100 | #145 | Good $44,790 |
| Irish | 75.8 /100 | #146 | Good $44,679 |
| Czechs | 74.1 /100 | #147 | Good $44,595 |
| Immigrants | Armenia | 73.1 /100 | #148 | Good $44,552 |
| Koreans | 72.5 /100 | #149 | Good $44,522 |
| Immigrants | Eritrea | 72.1 /100 | #150 | Good $44,509 |