Tlingit-Haida vs Immigrants from Uganda Per Capita Income
COMPARE
Tlingit-Haida
Immigrants from Uganda
Per Capita Income
Per Capita Income Comparison
Tlingit-Haida
Immigrants from Uganda
$43,516
PER CAPITA INCOME
45.9/ 100
METRIC RATING
177th/ 347
METRIC RANK
$45,043
PER CAPITA INCOME
82.5/ 100
METRIC RATING
143rd/ 347
METRIC RANK
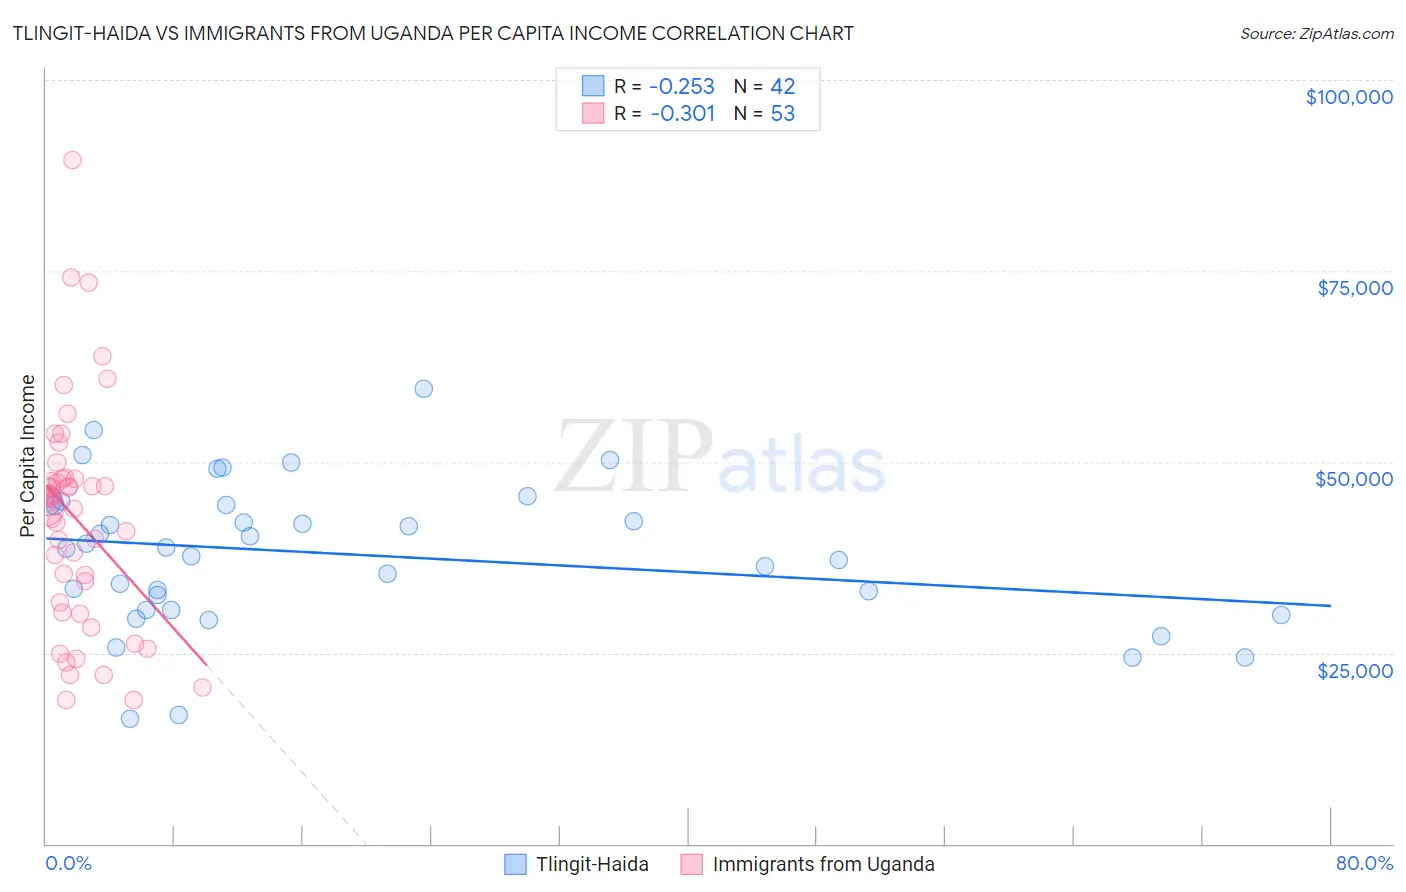
Tlingit-Haida vs Immigrants from Uganda Per Capita Income Correlation Chart
The statistical analysis conducted on geographies consisting of 60,872,339 people shows a weak negative correlation between the proportion of Tlingit-Haida and per capita income in the United States with a correlation coefficient (R) of -0.253 and weighted average of $43,516. Similarly, the statistical analysis conducted on geographies consisting of 125,982,219 people shows a mild negative correlation between the proportion of Immigrants from Uganda and per capita income in the United States with a correlation coefficient (R) of -0.301 and weighted average of $45,043, a difference of 3.5%.
Per Capita Income Correlation Summary
| Measurement | Tlingit-Haida | Immigrants from Uganda |
| Minimum | $16,326 | $18,741 |
| Maximum | $59,619 | $89,561 |
| Range | $43,293 | $70,820 |
| Mean | $37,894 | $42,540 |
| Median | $38,682 | $45,016 |
| Interquartile 25% (IQ1) | $30,599 | $30,934 |
| Interquartile 75% (IQ3) | $44,372 | $47,740 |
| Interquartile Range (IQR) | $13,773 | $16,806 |
| Standard Deviation (Sample) | $9,586 | $14,536 |
| Standard Deviation (Population) | $9,471 | $14,398 |
Similar Demographics by Per Capita Income
Demographics Similar to Tlingit-Haida by Per Capita Income
In terms of per capita income, the demographic groups most similar to Tlingit-Haida are Immigrants from South Eastern Asia ($43,539, a difference of 0.050%), Immigrants from Costa Rica ($43,464, a difference of 0.12%), Finnish ($43,461, a difference of 0.13%), Celtic ($43,621, a difference of 0.24%), and Sierra Leonean ($43,405, a difference of 0.25%).
| Demographics | Rating | Rank | Per Capita Income |
| Scandinavians | 55.2 /100 | #170 | Average $43,848 |
| Immigrants | Eastern Africa | 54.9 /100 | #171 | Average $43,838 |
| Czechoslovakians | 54.1 /100 | #172 | Average $43,806 |
| French | 50.7 /100 | #173 | Average $43,685 |
| Colombians | 50.0 /100 | #174 | Average $43,661 |
| Celtics | 48.9 /100 | #175 | Average $43,621 |
| Immigrants | South Eastern Asia | 46.6 /100 | #176 | Average $43,539 |
| Tlingit-Haida | 45.9 /100 | #177 | Average $43,516 |
| Immigrants | Costa Rica | 44.5 /100 | #178 | Average $43,464 |
| Finns | 44.4 /100 | #179 | Average $43,461 |
| Sierra Leoneans | 42.9 /100 | #180 | Average $43,405 |
| Welsh | 38.2 /100 | #181 | Fair $43,233 |
| Immigrants | Vietnam | 38.1 /100 | #182 | Fair $43,229 |
| Germans | 33.9 /100 | #183 | Fair $43,067 |
| Spaniards | 32.9 /100 | #184 | Fair $43,028 |
Demographics Similar to Immigrants from Uganda by Per Capita Income
In terms of per capita income, the demographic groups most similar to Immigrants from Uganda are Slavic ($45,049, a difference of 0.010%), Ugandan ($45,047, a difference of 0.010%), Immigrants from Jordan ($45,066, a difference of 0.050%), Basque ($45,086, a difference of 0.10%), and Icelander ($44,987, a difference of 0.12%).
| Demographics | Rating | Rank | Per Capita Income |
| Immigrants | Oceania | 85.2 /100 | #136 | Excellent $45,220 |
| Immigrants | Syria | 85.2 /100 | #137 | Excellent $45,218 |
| Assyrians/Chaldeans/Syriacs | 84.8 /100 | #138 | Excellent $45,195 |
| Basques | 83.2 /100 | #139 | Excellent $45,086 |
| Immigrants | Jordan | 82.9 /100 | #140 | Excellent $45,066 |
| Slavs | 82.6 /100 | #141 | Excellent $45,049 |
| Ugandans | 82.6 /100 | #142 | Excellent $45,047 |
| Immigrants | Uganda | 82.5 /100 | #143 | Excellent $45,043 |
| Icelanders | 81.6 /100 | #144 | Excellent $44,987 |
| Immigrants | Afghanistan | 78.0 /100 | #145 | Good $44,790 |
| Irish | 75.8 /100 | #146 | Good $44,679 |
| Czechs | 74.1 /100 | #147 | Good $44,595 |
| Immigrants | Armenia | 73.1 /100 | #148 | Good $44,552 |
| Koreans | 72.5 /100 | #149 | Good $44,522 |
| Immigrants | Eritrea | 72.1 /100 | #150 | Good $44,509 |