Senegalese vs Kiowa Per Capita Income
COMPARE
Senegalese
Kiowa
Per Capita Income
Per Capita Income Comparison
Senegalese
Kiowa
$41,000
PER CAPITA INCOME
4.8/ 100
METRIC RATING
231st/ 347
METRIC RANK
$35,102
PER CAPITA INCOME
0.0/ 100
METRIC RATING
324th/ 347
METRIC RANK
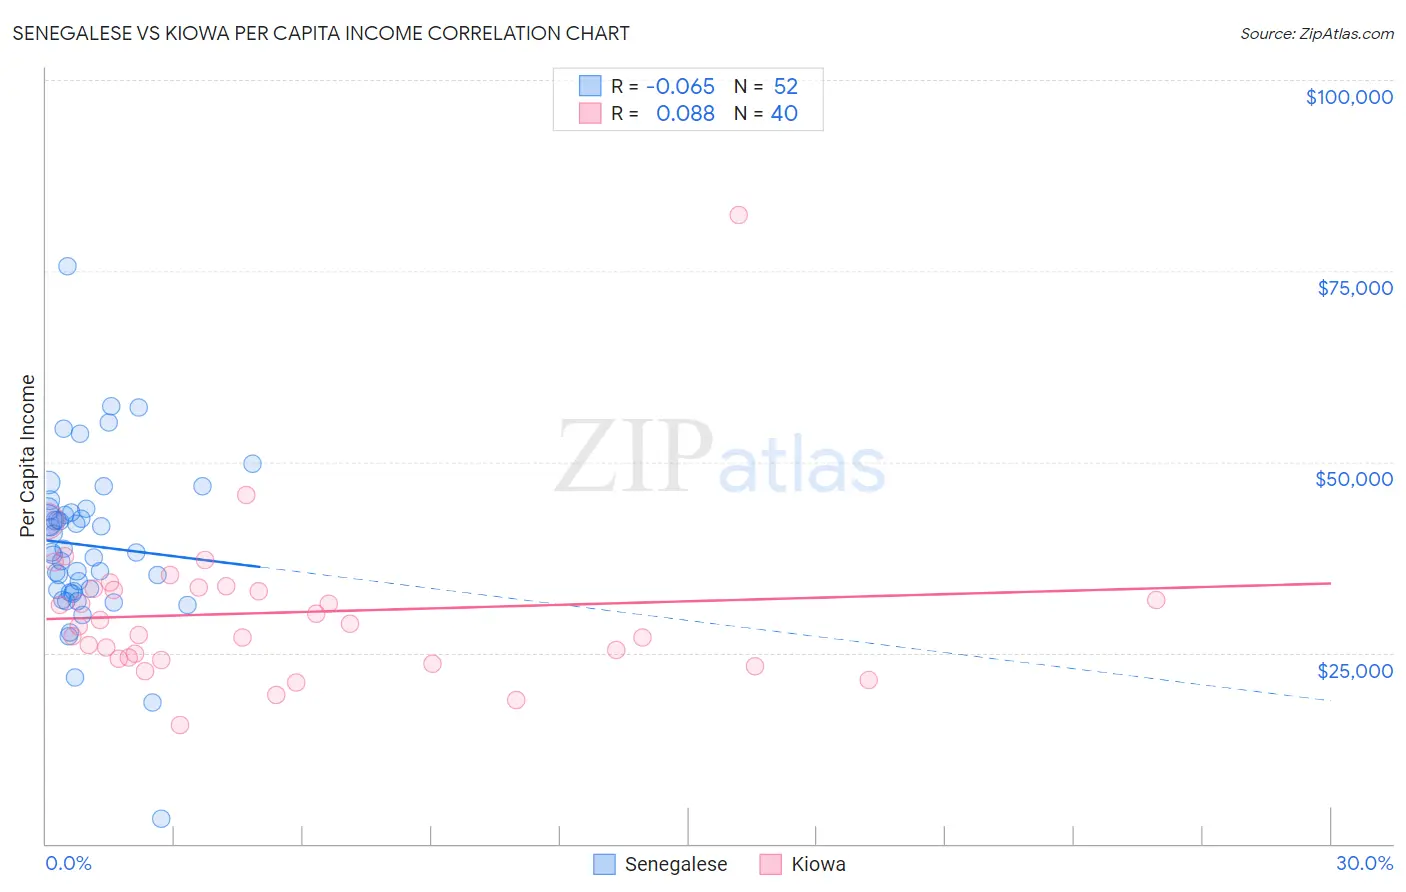
Senegalese vs Kiowa Per Capita Income Correlation Chart
The statistical analysis conducted on geographies consisting of 78,107,792 people shows a slight negative correlation between the proportion of Senegalese and per capita income in the United States with a correlation coefficient (R) of -0.065 and weighted average of $41,000. Similarly, the statistical analysis conducted on geographies consisting of 56,101,664 people shows a slight positive correlation between the proportion of Kiowa and per capita income in the United States with a correlation coefficient (R) of 0.088 and weighted average of $35,102, a difference of 16.8%.
Per Capita Income Correlation Summary
| Measurement | Senegalese | Kiowa |
| Minimum | $3,219 | $15,468 |
| Maximum | $75,539 | $82,387 |
| Range | $72,320 | $66,919 |
| Mean | $39,064 | $30,249 |
| Median | $38,147 | $28,572 |
| Interquartile 25% (IQ1) | $33,014 | $24,302 |
| Interquartile 75% (IQ3) | $43,632 | $33,441 |
| Interquartile Range (IQR) | $10,618 | $9,140 |
| Standard Deviation (Sample) | $10,948 | $10,578 |
| Standard Deviation (Population) | $10,843 | $10,445 |
Similar Demographics by Per Capita Income
Demographics Similar to Senegalese by Per Capita Income
In terms of per capita income, the demographic groups most similar to Senegalese are Native Hawaiian ($41,017, a difference of 0.040%), Nigerian ($41,026, a difference of 0.060%), Guyanese ($40,949, a difference of 0.12%), Immigrants from Grenada ($41,123, a difference of 0.30%), and Immigrants from Ghana ($41,131, a difference of 0.32%).
| Demographics | Rating | Rank | Per Capita Income |
| Immigrants | St. Vincent and the Grenadines | 6.4 /100 | #224 | Tragic $41,270 |
| West Indians | 6.0 /100 | #225 | Tragic $41,217 |
| Immigrants | Ecuador | 5.9 /100 | #226 | Tragic $41,195 |
| Immigrants | Ghana | 5.5 /100 | #227 | Tragic $41,131 |
| Immigrants | Grenada | 5.5 /100 | #228 | Tragic $41,123 |
| Nigerians | 4.9 /100 | #229 | Tragic $41,026 |
| Native Hawaiians | 4.9 /100 | #230 | Tragic $41,017 |
| Senegalese | 4.8 /100 | #231 | Tragic $41,000 |
| Guyanese | 4.5 /100 | #232 | Tragic $40,949 |
| Delaware | 3.8 /100 | #233 | Tragic $40,778 |
| Immigrants | West Indies | 3.7 /100 | #234 | Tragic $40,763 |
| Immigrants | Guyana | 3.6 /100 | #235 | Tragic $40,742 |
| Immigrants | Nonimmigrants | 3.4 /100 | #236 | Tragic $40,669 |
| Immigrants | Cambodia | 2.6 /100 | #237 | Tragic $40,434 |
| Somalis | 2.4 /100 | #238 | Tragic $40,367 |
Demographics Similar to Kiowa by Per Capita Income
In terms of per capita income, the demographic groups most similar to Kiowa are Immigrants from Central America ($34,974, a difference of 0.37%), Cheyenne ($35,276, a difference of 0.50%), Immigrants from Cuba ($34,910, a difference of 0.55%), Apache ($34,886, a difference of 0.62%), and Creek ($35,546, a difference of 1.3%).
| Demographics | Rating | Rank | Per Capita Income |
| Dutch West Indians | 0.0 /100 | #317 | Tragic $35,922 |
| Bangladeshis | 0.0 /100 | #318 | Tragic $35,897 |
| Immigrants | Congo | 0.0 /100 | #319 | Tragic $35,720 |
| Hispanics or Latinos | 0.0 /100 | #320 | Tragic $35,688 |
| Blacks/African Americans | 0.0 /100 | #321 | Tragic $35,564 |
| Creek | 0.0 /100 | #322 | Tragic $35,546 |
| Cheyenne | 0.0 /100 | #323 | Tragic $35,276 |
| Kiowa | 0.0 /100 | #324 | Tragic $35,102 |
| Immigrants | Central America | 0.0 /100 | #325 | Tragic $34,974 |
| Immigrants | Cuba | 0.0 /100 | #326 | Tragic $34,910 |
| Apache | 0.0 /100 | #327 | Tragic $34,886 |
| Menominee | 0.0 /100 | #328 | Tragic $34,578 |
| Mexicans | 0.0 /100 | #329 | Tragic $34,559 |
| Spanish American Indians | 0.0 /100 | #330 | Tragic $34,195 |
| Immigrants | Mexico | 0.0 /100 | #331 | Tragic $33,931 |