Senegalese vs Immigrants from Poland Per Capita Income
COMPARE
Senegalese
Immigrants from Poland
Per Capita Income
Per Capita Income Comparison
Senegalese
Immigrants from Poland
$41,000
PER CAPITA INCOME
4.8/ 100
METRIC RATING
231st/ 347
METRIC RANK
$45,979
PER CAPITA INCOME
93.1/ 100
METRIC RATING
119th/ 347
METRIC RANK
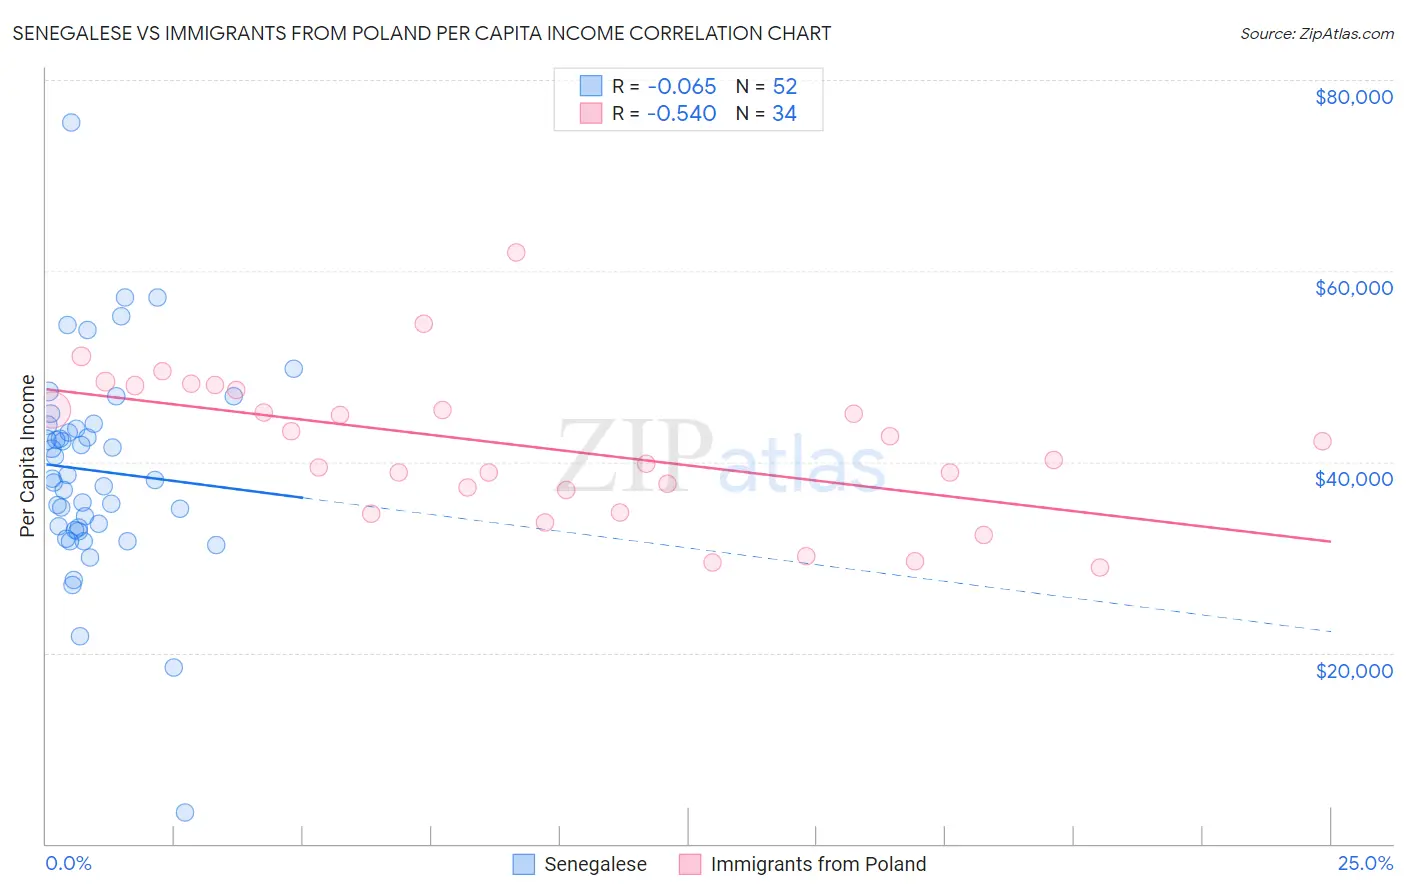
Senegalese vs Immigrants from Poland Per Capita Income Correlation Chart
The statistical analysis conducted on geographies consisting of 78,107,792 people shows a slight negative correlation between the proportion of Senegalese and per capita income in the United States with a correlation coefficient (R) of -0.065 and weighted average of $41,000. Similarly, the statistical analysis conducted on geographies consisting of 304,861,873 people shows a substantial negative correlation between the proportion of Immigrants from Poland and per capita income in the United States with a correlation coefficient (R) of -0.540 and weighted average of $45,979, a difference of 12.1%.
Per Capita Income Correlation Summary
| Measurement | Senegalese | Immigrants from Poland |
| Minimum | $3,219 | $28,915 |
| Maximum | $75,539 | $61,894 |
| Range | $72,320 | $32,979 |
| Mean | $39,064 | $41,553 |
| Median | $38,147 | $41,224 |
| Interquartile 25% (IQ1) | $33,014 | $37,111 |
| Interquartile 75% (IQ3) | $43,632 | $47,562 |
| Interquartile Range (IQR) | $10,618 | $10,451 |
| Standard Deviation (Sample) | $10,948 | $7,628 |
| Standard Deviation (Population) | $10,843 | $7,515 |
Similar Demographics by Per Capita Income
Demographics Similar to Senegalese by Per Capita Income
In terms of per capita income, the demographic groups most similar to Senegalese are Native Hawaiian ($41,017, a difference of 0.040%), Nigerian ($41,026, a difference of 0.060%), Guyanese ($40,949, a difference of 0.12%), Immigrants from Grenada ($41,123, a difference of 0.30%), and Immigrants from Ghana ($41,131, a difference of 0.32%).
| Demographics | Rating | Rank | Per Capita Income |
| Immigrants | St. Vincent and the Grenadines | 6.4 /100 | #224 | Tragic $41,270 |
| West Indians | 6.0 /100 | #225 | Tragic $41,217 |
| Immigrants | Ecuador | 5.9 /100 | #226 | Tragic $41,195 |
| Immigrants | Ghana | 5.5 /100 | #227 | Tragic $41,131 |
| Immigrants | Grenada | 5.5 /100 | #228 | Tragic $41,123 |
| Nigerians | 4.9 /100 | #229 | Tragic $41,026 |
| Native Hawaiians | 4.9 /100 | #230 | Tragic $41,017 |
| Senegalese | 4.8 /100 | #231 | Tragic $41,000 |
| Guyanese | 4.5 /100 | #232 | Tragic $40,949 |
| Delaware | 3.8 /100 | #233 | Tragic $40,778 |
| Immigrants | West Indies | 3.7 /100 | #234 | Tragic $40,763 |
| Immigrants | Guyana | 3.6 /100 | #235 | Tragic $40,742 |
| Immigrants | Nonimmigrants | 3.4 /100 | #236 | Tragic $40,669 |
| Immigrants | Cambodia | 2.6 /100 | #237 | Tragic $40,434 |
| Somalis | 2.4 /100 | #238 | Tragic $40,367 |
Demographics Similar to Immigrants from Poland by Per Capita Income
In terms of per capita income, the demographic groups most similar to Immigrants from Poland are Immigrants from Saudi Arabia ($46,008, a difference of 0.060%), Immigrants from Ethiopia ($45,923, a difference of 0.12%), Chinese ($46,098, a difference of 0.26%), Canadian ($45,858, a difference of 0.27%), and Moroccan ($45,854, a difference of 0.27%).
| Demographics | Rating | Rank | Per Capita Income |
| Immigrants | Morocco | 95.7 /100 | #112 | Exceptional $46,430 |
| Immigrants | Albania | 95.5 /100 | #113 | Exceptional $46,387 |
| Afghans | 94.9 /100 | #114 | Exceptional $46,268 |
| Immigrants | Chile | 94.6 /100 | #115 | Exceptional $46,213 |
| Poles | 94.1 /100 | #116 | Exceptional $46,123 |
| Chinese | 93.9 /100 | #117 | Exceptional $46,098 |
| Immigrants | Saudi Arabia | 93.3 /100 | #118 | Exceptional $46,008 |
| Immigrants | Poland | 93.1 /100 | #119 | Exceptional $45,979 |
| Immigrants | Ethiopia | 92.7 /100 | #120 | Exceptional $45,923 |
| Canadians | 92.2 /100 | #121 | Exceptional $45,858 |
| Moroccans | 92.1 /100 | #122 | Exceptional $45,854 |
| Lebanese | 92.0 /100 | #123 | Exceptional $45,840 |
| Europeans | 92.0 /100 | #124 | Exceptional $45,836 |
| Zimbabweans | 91.7 /100 | #125 | Exceptional $45,804 |
| Palestinians | 91.6 /100 | #126 | Exceptional $45,790 |