Senegalese vs Immigrants from Kuwait Male Unemployment
COMPARE
Senegalese
Immigrants from Kuwait
Male Unemployment
Male Unemployment Comparison
Senegalese
Immigrants from Kuwait
6.4%
MALE UNEMPLOYMENT
0.0/ 100
METRIC RATING
294th/ 347
METRIC RANK
5.1%
MALE UNEMPLOYMENT
93.3/ 100
METRIC RATING
98th/ 347
METRIC RANK
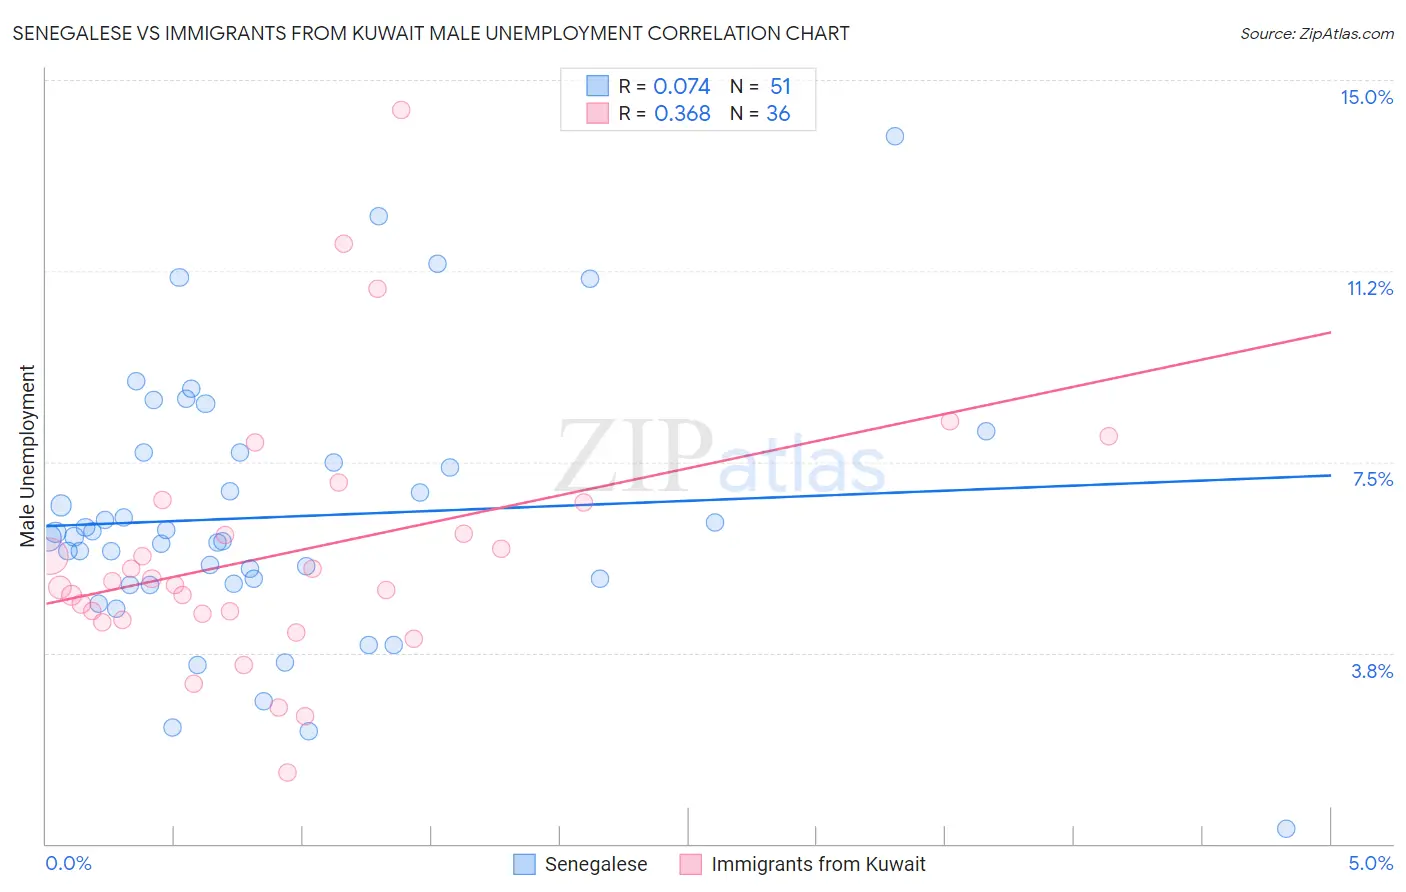
Senegalese vs Immigrants from Kuwait Male Unemployment Correlation Chart
The statistical analysis conducted on geographies consisting of 78,095,938 people shows a slight positive correlation between the proportion of Senegalese and unemployment rate among males in the United States with a correlation coefficient (R) of 0.074 and weighted average of 6.4%. Similarly, the statistical analysis conducted on geographies consisting of 136,850,948 people shows a mild positive correlation between the proportion of Immigrants from Kuwait and unemployment rate among males in the United States with a correlation coefficient (R) of 0.368 and weighted average of 5.1%, a difference of 26.6%.
Male Unemployment Correlation Summary
| Measurement | Senegalese | Immigrants from Kuwait |
| Minimum | 0.30% | 1.4% |
| Maximum | 13.9% | 14.4% |
| Range | 13.6% | 13.0% |
| Mean | 6.4% | 5.7% |
| Median | 6.0% | 5.1% |
| Interquartile 25% (IQ1) | 5.1% | 4.5% |
| Interquartile 75% (IQ3) | 7.7% | 6.4% |
| Interquartile Range (IQR) | 2.6% | 1.9% |
| Standard Deviation (Sample) | 2.6% | 2.5% |
| Standard Deviation (Population) | 2.6% | 2.5% |
Similar Demographics by Male Unemployment
Demographics Similar to Senegalese by Male Unemployment
In terms of male unemployment, the demographic groups most similar to Senegalese are Haitian (6.4%, a difference of 0.11%), Nepalese (6.4%, a difference of 0.14%), Immigrants from the Azores (6.4%, a difference of 0.48%), Belizean (6.5%, a difference of 0.85%), and U.S. Virgin Islander (6.4%, a difference of 1.0%).
| Demographics | Rating | Rank | Male Unemployment |
| Central American Indians | 0.0 /100 | #287 | Tragic 6.3% |
| Immigrants | Senegal | 0.0 /100 | #288 | Tragic 6.3% |
| Immigrants | Caribbean | 0.0 /100 | #289 | Tragic 6.3% |
| U.S. Virgin Islanders | 0.0 /100 | #290 | Tragic 6.4% |
| Immigrants | Azores | 0.0 /100 | #291 | Tragic 6.4% |
| Nepalese | 0.0 /100 | #292 | Tragic 6.4% |
| Haitians | 0.0 /100 | #293 | Tragic 6.4% |
| Senegalese | 0.0 /100 | #294 | Tragic 6.4% |
| Belizeans | 0.0 /100 | #295 | Tragic 6.5% |
| Immigrants | Haiti | 0.0 /100 | #296 | Tragic 6.5% |
| Chippewa | 0.0 /100 | #297 | Tragic 6.6% |
| Jamaicans | 0.0 /100 | #298 | Tragic 6.6% |
| Immigrants | Bangladesh | 0.0 /100 | #299 | Tragic 6.6% |
| Vietnamese | 0.0 /100 | #300 | Tragic 6.6% |
| Immigrants | Belize | 0.0 /100 | #301 | Tragic 6.6% |
Demographics Similar to Immigrants from Kuwait by Male Unemployment
In terms of male unemployment, the demographic groups most similar to Immigrants from Kuwait are Immigrants from Spain (5.1%, a difference of 0.040%), Uruguayan (5.1%, a difference of 0.070%), Russian (5.1%, a difference of 0.080%), Asian (5.1%, a difference of 0.11%), and German Russian (5.1%, a difference of 0.12%).
| Demographics | Rating | Rank | Male Unemployment |
| Immigrants | Turkey | 94.4 /100 | #91 | Exceptional 5.1% |
| Slavs | 94.2 /100 | #92 | Exceptional 5.1% |
| Immigrants | Serbia | 94.2 /100 | #93 | Exceptional 5.1% |
| Canadians | 94.1 /100 | #94 | Exceptional 5.1% |
| Italians | 93.8 /100 | #95 | Exceptional 5.1% |
| Asians | 93.7 /100 | #96 | Exceptional 5.1% |
| Immigrants | Spain | 93.4 /100 | #97 | Exceptional 5.1% |
| Immigrants | Kuwait | 93.3 /100 | #98 | Exceptional 5.1% |
| Uruguayans | 93.0 /100 | #99 | Exceptional 5.1% |
| Russians | 92.9 /100 | #100 | Exceptional 5.1% |
| German Russians | 92.7 /100 | #101 | Exceptional 5.1% |
| Immigrants | France | 92.7 /100 | #102 | Exceptional 5.1% |
| Immigrants | Jordan | 91.9 /100 | #103 | Exceptional 5.1% |
| Immigrants | Chile | 91.8 /100 | #104 | Exceptional 5.1% |
| Immigrants | Czechoslovakia | 91.7 /100 | #105 | Exceptional 5.1% |