Moroccan vs Czechoslovakian Median Male Earnings
COMPARE
Moroccan
Czechoslovakian
Median Male Earnings
Median Male Earnings Comparison
Moroccans
Czechoslovakians
$56,499
MEDIAN MALE EARNINGS
87.7/ 100
METRIC RATING
134th/ 347
METRIC RANK
$55,382
MEDIAN MALE EARNINGS
70.5/ 100
METRIC RATING
158th/ 347
METRIC RANK
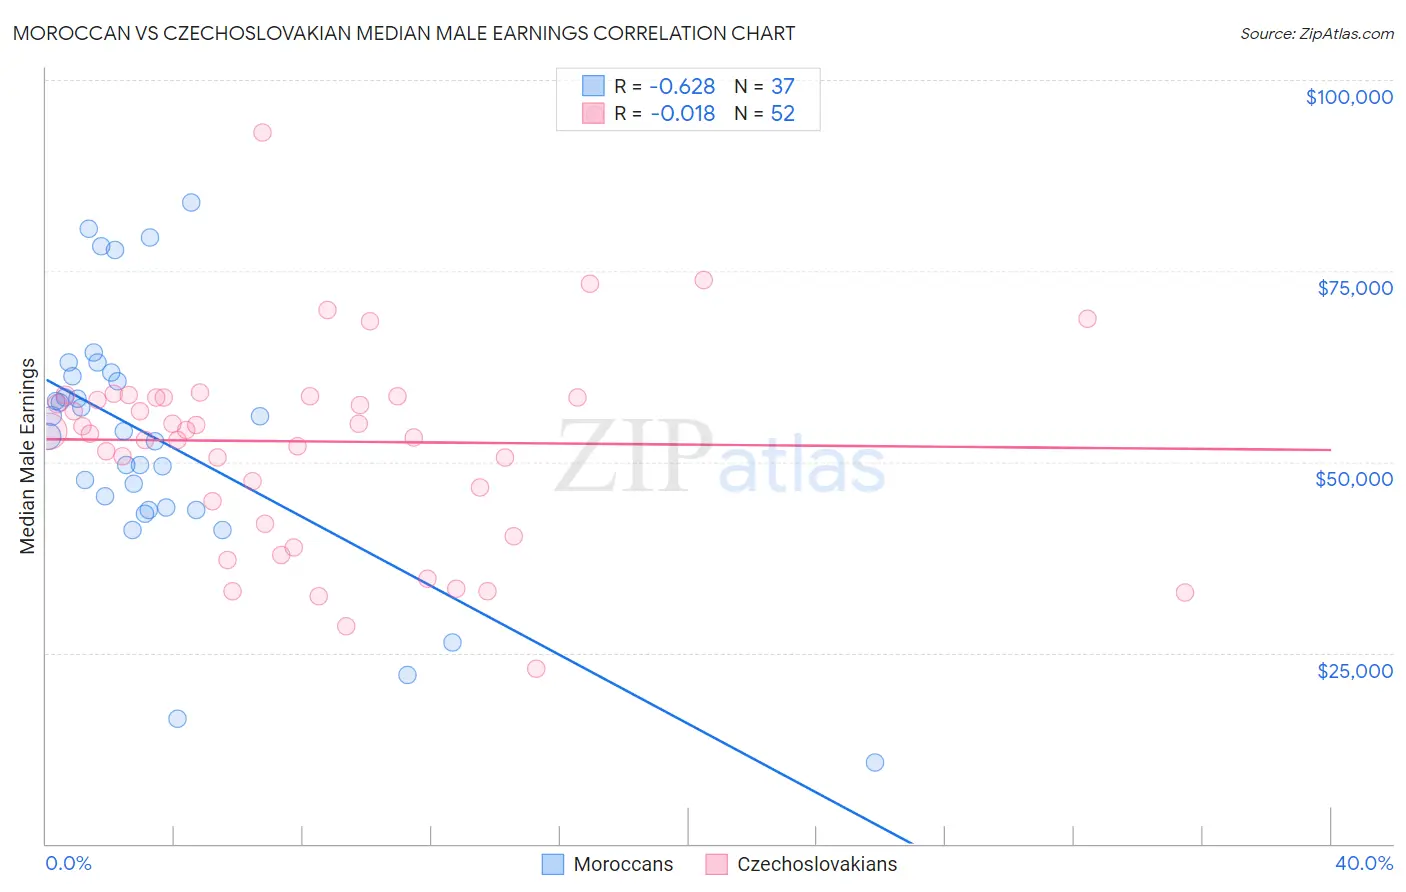
Moroccan vs Czechoslovakian Median Male Earnings Correlation Chart
The statistical analysis conducted on geographies consisting of 201,785,575 people shows a significant negative correlation between the proportion of Moroccans and median male earnings in the United States with a correlation coefficient (R) of -0.628 and weighted average of $56,499. Similarly, the statistical analysis conducted on geographies consisting of 368,529,148 people shows no correlation between the proportion of Czechoslovakians and median male earnings in the United States with a correlation coefficient (R) of -0.018 and weighted average of $55,382, a difference of 2.0%.
Median Male Earnings Correlation Summary
| Measurement | Moroccan | Czechoslovakian |
| Minimum | $10,662 | $22,917 |
| Maximum | $84,023 | $95,417 |
| Range | $73,361 | $72,500 |
| Mean | $52,885 | $52,664 |
| Median | $54,008 | $54,109 |
| Interquartile 25% (IQ1) | $43,924 | $43,411 |
| Interquartile 75% (IQ3) | $61,434 | $58,532 |
| Interquartile Range (IQR) | $17,511 | $15,121 |
| Standard Deviation (Sample) | $16,590 | $14,290 |
| Standard Deviation (Population) | $16,364 | $14,152 |
Similar Demographics by Median Male Earnings
Demographics Similar to Moroccans by Median Male Earnings
In terms of median male earnings, the demographic groups most similar to Moroccans are Irish ($56,464, a difference of 0.060%), Czech ($56,546, a difference of 0.080%), Immigrants from Germany ($56,542, a difference of 0.080%), Immigrants from Saudi Arabia ($56,452, a difference of 0.080%), and Slavic ($56,390, a difference of 0.19%).
| Demographics | Rating | Rank | Median Male Earnings |
| Brazilians | 90.9 /100 | #127 | Exceptional $56,837 |
| Immigrants | Syria | 90.8 /100 | #128 | Exceptional $56,830 |
| Pakistanis | 89.9 /100 | #129 | Excellent $56,719 |
| Koreans | 89.4 /100 | #130 | Excellent $56,672 |
| Portuguese | 89.4 /100 | #131 | Excellent $56,663 |
| Czechs | 88.2 /100 | #132 | Excellent $56,546 |
| Immigrants | Germany | 88.2 /100 | #133 | Excellent $56,542 |
| Moroccans | 87.7 /100 | #134 | Excellent $56,499 |
| Irish | 87.4 /100 | #135 | Excellent $56,464 |
| Immigrants | Saudi Arabia | 87.2 /100 | #136 | Excellent $56,452 |
| Slavs | 86.5 /100 | #137 | Excellent $56,390 |
| Slovaks | 85.5 /100 | #138 | Excellent $56,306 |
| Zimbabweans | 85.5 /100 | #139 | Excellent $56,302 |
| Luxembourgers | 85.5 /100 | #140 | Excellent $56,300 |
| Danes | 84.8 /100 | #141 | Excellent $56,246 |
Demographics Similar to Czechoslovakians by Median Male Earnings
In terms of median male earnings, the demographic groups most similar to Czechoslovakians are Alsatian ($55,380, a difference of 0.0%), Basque ($55,370, a difference of 0.020%), Belgian ($55,361, a difference of 0.040%), Icelander ($55,415, a difference of 0.060%), and French ($55,350, a difference of 0.060%).
| Demographics | Rating | Rank | Median Male Earnings |
| Immigrants | Oceania | 76.8 /100 | #151 | Good $55,712 |
| Peruvians | 75.8 /100 | #152 | Good $55,659 |
| Immigrants | Nepal | 75.0 /100 | #153 | Good $55,615 |
| Taiwanese | 73.9 /100 | #154 | Good $55,556 |
| Scandinavians | 73.4 /100 | #155 | Good $55,527 |
| Immigrants | Ethiopia | 71.6 /100 | #156 | Good $55,434 |
| Icelanders | 71.2 /100 | #157 | Good $55,415 |
| Czechoslovakians | 70.5 /100 | #158 | Good $55,382 |
| Alsatians | 70.5 /100 | #159 | Good $55,380 |
| Basques | 70.3 /100 | #160 | Good $55,370 |
| Belgians | 70.1 /100 | #161 | Good $55,361 |
| French | 69.9 /100 | #162 | Good $55,350 |
| Ugandans | 68.6 /100 | #163 | Good $55,290 |
| Immigrants | South Eastern Asia | 67.6 /100 | #164 | Good $55,241 |
| Immigrants | Portugal | 66.3 /100 | #165 | Good $55,182 |