Moroccan vs Immigrants from Panama Median Male Earnings
COMPARE
Moroccan
Immigrants from Panama
Median Male Earnings
Median Male Earnings Comparison
Moroccans
Immigrants from Panama
$56,499
MEDIAN MALE EARNINGS
87.7/ 100
METRIC RATING
134th/ 347
METRIC RANK
$51,962
MEDIAN MALE EARNINGS
7.7/ 100
METRIC RATING
218th/ 347
METRIC RANK
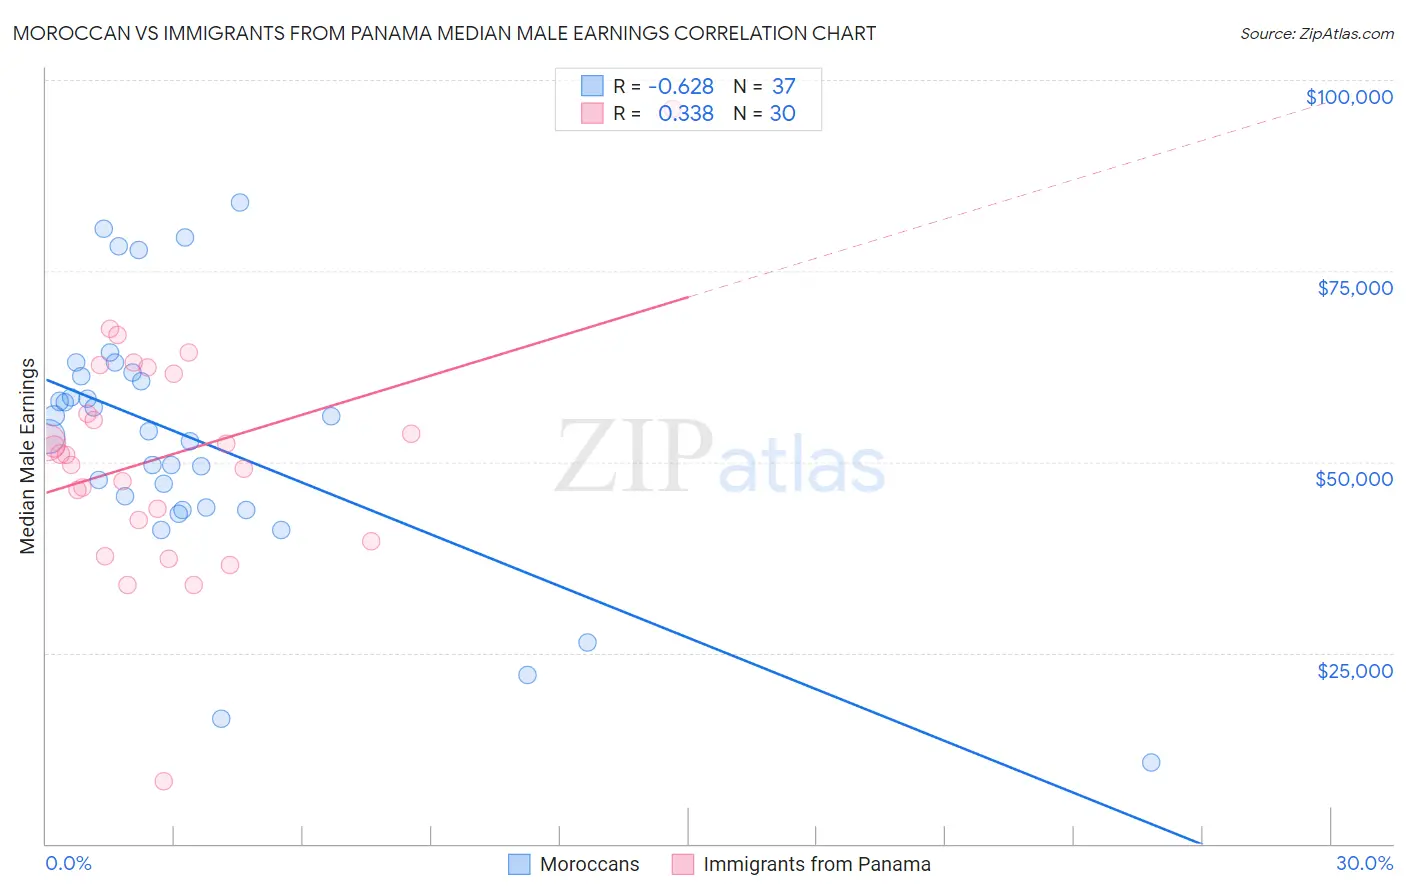
Moroccan vs Immigrants from Panama Median Male Earnings Correlation Chart
The statistical analysis conducted on geographies consisting of 201,785,575 people shows a significant negative correlation between the proportion of Moroccans and median male earnings in the United States with a correlation coefficient (R) of -0.628 and weighted average of $56,499. Similarly, the statistical analysis conducted on geographies consisting of 221,157,790 people shows a mild positive correlation between the proportion of Immigrants from Panama and median male earnings in the United States with a correlation coefficient (R) of 0.338 and weighted average of $51,962, a difference of 8.7%.
Median Male Earnings Correlation Summary
| Measurement | Moroccan | Immigrants from Panama |
| Minimum | $10,662 | $8,214 |
| Maximum | $84,023 | $96,250 |
| Range | $73,361 | $88,036 |
| Mean | $52,885 | $50,691 |
| Median | $54,008 | $50,981 |
| Interquartile 25% (IQ1) | $43,924 | $42,361 |
| Interquartile 75% (IQ3) | $61,434 | $61,515 |
| Interquartile Range (IQR) | $17,511 | $19,154 |
| Standard Deviation (Sample) | $16,590 | $15,111 |
| Standard Deviation (Population) | $16,364 | $14,857 |
Similar Demographics by Median Male Earnings
Demographics Similar to Moroccans by Median Male Earnings
In terms of median male earnings, the demographic groups most similar to Moroccans are Irish ($56,464, a difference of 0.060%), Czech ($56,546, a difference of 0.080%), Immigrants from Germany ($56,542, a difference of 0.080%), Immigrants from Saudi Arabia ($56,452, a difference of 0.080%), and Slavic ($56,390, a difference of 0.19%).
| Demographics | Rating | Rank | Median Male Earnings |
| Brazilians | 90.9 /100 | #127 | Exceptional $56,837 |
| Immigrants | Syria | 90.8 /100 | #128 | Exceptional $56,830 |
| Pakistanis | 89.9 /100 | #129 | Excellent $56,719 |
| Koreans | 89.4 /100 | #130 | Excellent $56,672 |
| Portuguese | 89.4 /100 | #131 | Excellent $56,663 |
| Czechs | 88.2 /100 | #132 | Excellent $56,546 |
| Immigrants | Germany | 88.2 /100 | #133 | Excellent $56,542 |
| Moroccans | 87.7 /100 | #134 | Excellent $56,499 |
| Irish | 87.4 /100 | #135 | Excellent $56,464 |
| Immigrants | Saudi Arabia | 87.2 /100 | #136 | Excellent $56,452 |
| Slavs | 86.5 /100 | #137 | Excellent $56,390 |
| Slovaks | 85.5 /100 | #138 | Excellent $56,306 |
| Zimbabweans | 85.5 /100 | #139 | Excellent $56,302 |
| Luxembourgers | 85.5 /100 | #140 | Excellent $56,300 |
| Danes | 84.8 /100 | #141 | Excellent $56,246 |
Demographics Similar to Immigrants from Panama by Median Male Earnings
In terms of median male earnings, the demographic groups most similar to Immigrants from Panama are Immigrants from Venezuela ($52,041, a difference of 0.15%), Nigerian ($52,039, a difference of 0.15%), Immigrants from Ghana ($51,836, a difference of 0.24%), Immigrants from Cameroon ($52,119, a difference of 0.30%), and Immigrants from Armenia ($51,793, a difference of 0.33%).
| Demographics | Rating | Rank | Median Male Earnings |
| Tlingit-Haida | 11.5 /100 | #211 | Poor $52,409 |
| Cajuns | 10.7 /100 | #212 | Poor $52,325 |
| Native Hawaiians | 10.5 /100 | #213 | Poor $52,306 |
| Immigrants | Nonimmigrants | 9.3 /100 | #214 | Tragic $52,170 |
| Immigrants | Cameroon | 8.9 /100 | #215 | Tragic $52,119 |
| Immigrants | Venezuela | 8.3 /100 | #216 | Tragic $52,041 |
| Nigerians | 8.3 /100 | #217 | Tragic $52,039 |
| Immigrants | Panama | 7.7 /100 | #218 | Tragic $51,962 |
| Immigrants | Ghana | 6.9 /100 | #219 | Tragic $51,836 |
| Immigrants | Armenia | 6.6 /100 | #220 | Tragic $51,793 |
| Immigrants | Senegal | 5.8 /100 | #221 | Tragic $51,647 |
| Immigrants | Bangladesh | 5.8 /100 | #222 | Tragic $51,642 |
| Ecuadorians | 5.5 /100 | #223 | Tragic $51,596 |
| Immigrants | Cambodia | 5.5 /100 | #224 | Tragic $51,594 |
| Immigrants | Sudan | 5.0 /100 | #225 | Tragic $51,489 |