Moroccan vs Immigrants from Laos Median Male Earnings
COMPARE
Moroccan
Immigrants from Laos
Median Male Earnings
Median Male Earnings Comparison
Moroccans
Immigrants from Laos
$56,499
MEDIAN MALE EARNINGS
87.7/ 100
METRIC RATING
134th/ 347
METRIC RANK
$49,190
MEDIAN MALE EARNINGS
0.6/ 100
METRIC RATING
265th/ 347
METRIC RANK
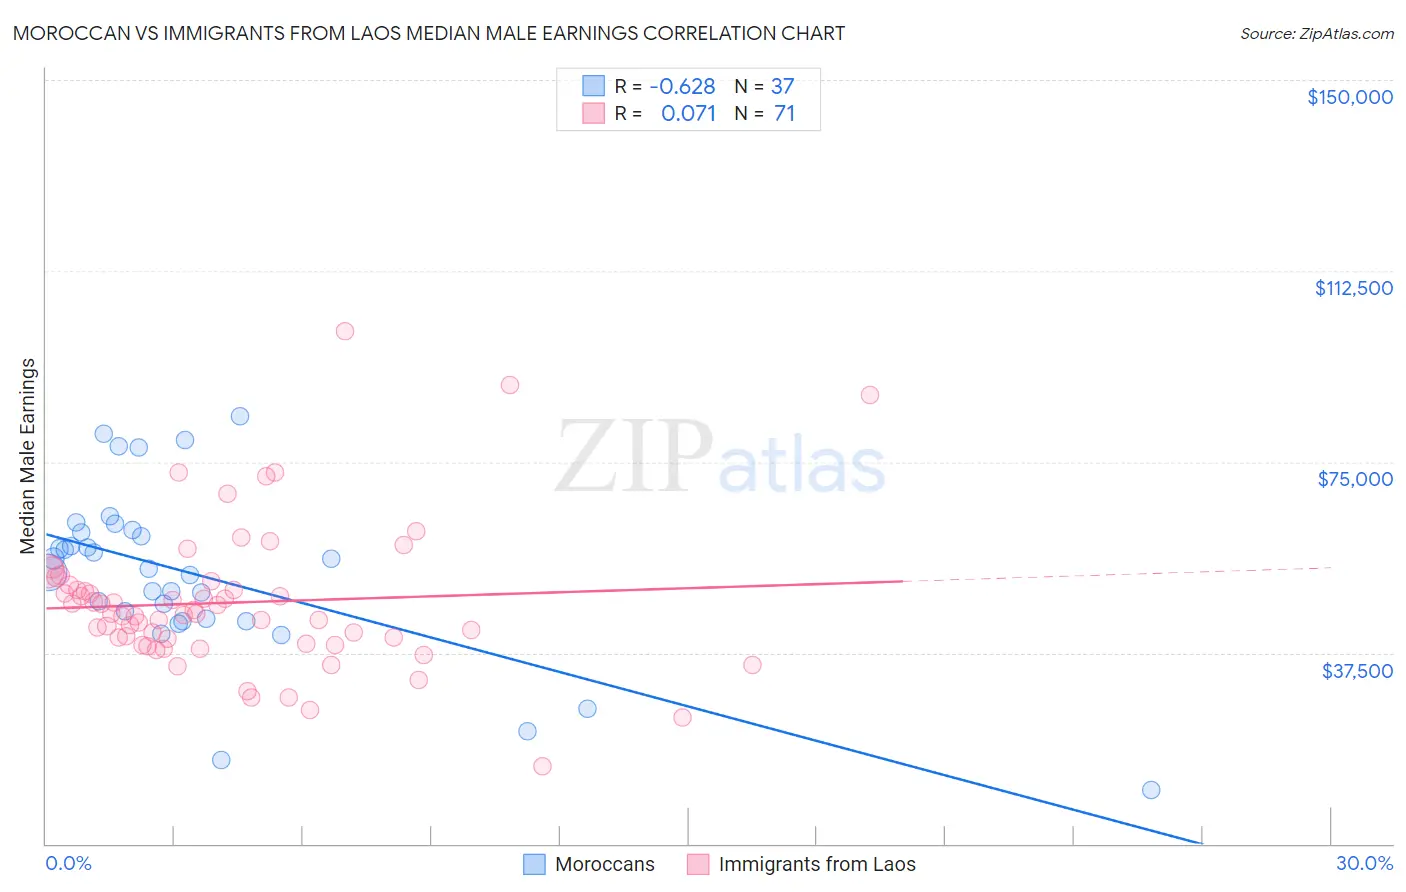
Moroccan vs Immigrants from Laos Median Male Earnings Correlation Chart
The statistical analysis conducted on geographies consisting of 201,785,575 people shows a significant negative correlation between the proportion of Moroccans and median male earnings in the United States with a correlation coefficient (R) of -0.628 and weighted average of $56,499. Similarly, the statistical analysis conducted on geographies consisting of 201,459,806 people shows a slight positive correlation between the proportion of Immigrants from Laos and median male earnings in the United States with a correlation coefficient (R) of 0.071 and weighted average of $49,190, a difference of 14.9%.
Median Male Earnings Correlation Summary
| Measurement | Moroccan | Immigrants from Laos |
| Minimum | $10,662 | $15,268 |
| Maximum | $84,023 | $100,625 |
| Range | $73,361 | $85,357 |
| Mean | $52,885 | $47,381 |
| Median | $54,008 | $45,153 |
| Interquartile 25% (IQ1) | $43,924 | $39,274 |
| Interquartile 75% (IQ3) | $61,434 | $50,916 |
| Interquartile Range (IQR) | $17,511 | $11,642 |
| Standard Deviation (Sample) | $16,590 | $14,342 |
| Standard Deviation (Population) | $16,364 | $14,241 |
Similar Demographics by Median Male Earnings
Demographics Similar to Moroccans by Median Male Earnings
In terms of median male earnings, the demographic groups most similar to Moroccans are Irish ($56,464, a difference of 0.060%), Czech ($56,546, a difference of 0.080%), Immigrants from Germany ($56,542, a difference of 0.080%), Immigrants from Saudi Arabia ($56,452, a difference of 0.080%), and Slavic ($56,390, a difference of 0.19%).
| Demographics | Rating | Rank | Median Male Earnings |
| Brazilians | 90.9 /100 | #127 | Exceptional $56,837 |
| Immigrants | Syria | 90.8 /100 | #128 | Exceptional $56,830 |
| Pakistanis | 89.9 /100 | #129 | Excellent $56,719 |
| Koreans | 89.4 /100 | #130 | Excellent $56,672 |
| Portuguese | 89.4 /100 | #131 | Excellent $56,663 |
| Czechs | 88.2 /100 | #132 | Excellent $56,546 |
| Immigrants | Germany | 88.2 /100 | #133 | Excellent $56,542 |
| Moroccans | 87.7 /100 | #134 | Excellent $56,499 |
| Irish | 87.4 /100 | #135 | Excellent $56,464 |
| Immigrants | Saudi Arabia | 87.2 /100 | #136 | Excellent $56,452 |
| Slavs | 86.5 /100 | #137 | Excellent $56,390 |
| Slovaks | 85.5 /100 | #138 | Excellent $56,306 |
| Zimbabweans | 85.5 /100 | #139 | Excellent $56,302 |
| Luxembourgers | 85.5 /100 | #140 | Excellent $56,300 |
| Danes | 84.8 /100 | #141 | Excellent $56,246 |
Demographics Similar to Immigrants from Laos by Median Male Earnings
In terms of median male earnings, the demographic groups most similar to Immigrants from Laos are Immigrants from Middle Africa ($49,201, a difference of 0.020%), Nicaraguan ($49,215, a difference of 0.050%), Immigrants from West Indies ($49,271, a difference of 0.16%), Liberian ($49,318, a difference of 0.26%), and Somali ($49,025, a difference of 0.34%).
| Demographics | Rating | Rank | Median Male Earnings |
| Cree | 0.7 /100 | #258 | Tragic $49,497 |
| Nepalese | 0.7 /100 | #259 | Tragic $49,458 |
| Iroquois | 0.7 /100 | #260 | Tragic $49,374 |
| Liberians | 0.6 /100 | #261 | Tragic $49,318 |
| Immigrants | West Indies | 0.6 /100 | #262 | Tragic $49,271 |
| Nicaraguans | 0.6 /100 | #263 | Tragic $49,215 |
| Immigrants | Middle Africa | 0.6 /100 | #264 | Tragic $49,201 |
| Immigrants | Laos | 0.6 /100 | #265 | Tragic $49,190 |
| Somalis | 0.5 /100 | #266 | Tragic $49,025 |
| Spanish Americans | 0.5 /100 | #267 | Tragic $49,008 |
| Ute | 0.4 /100 | #268 | Tragic $48,899 |
| Tsimshian | 0.4 /100 | #269 | Tragic $48,836 |
| Potawatomi | 0.4 /100 | #270 | Tragic $48,768 |
| Cherokee | 0.3 /100 | #271 | Tragic $48,669 |
| Salvadorans | 0.3 /100 | #272 | Tragic $48,646 |