Moroccan vs Immigrants from Oceania Median Male Earnings
COMPARE
Moroccan
Immigrants from Oceania
Median Male Earnings
Median Male Earnings Comparison
Moroccans
Immigrants from Oceania
$56,499
MEDIAN MALE EARNINGS
87.7/ 100
METRIC RATING
134th/ 347
METRIC RANK
$55,712
MEDIAN MALE EARNINGS
76.8/ 100
METRIC RATING
151st/ 347
METRIC RANK
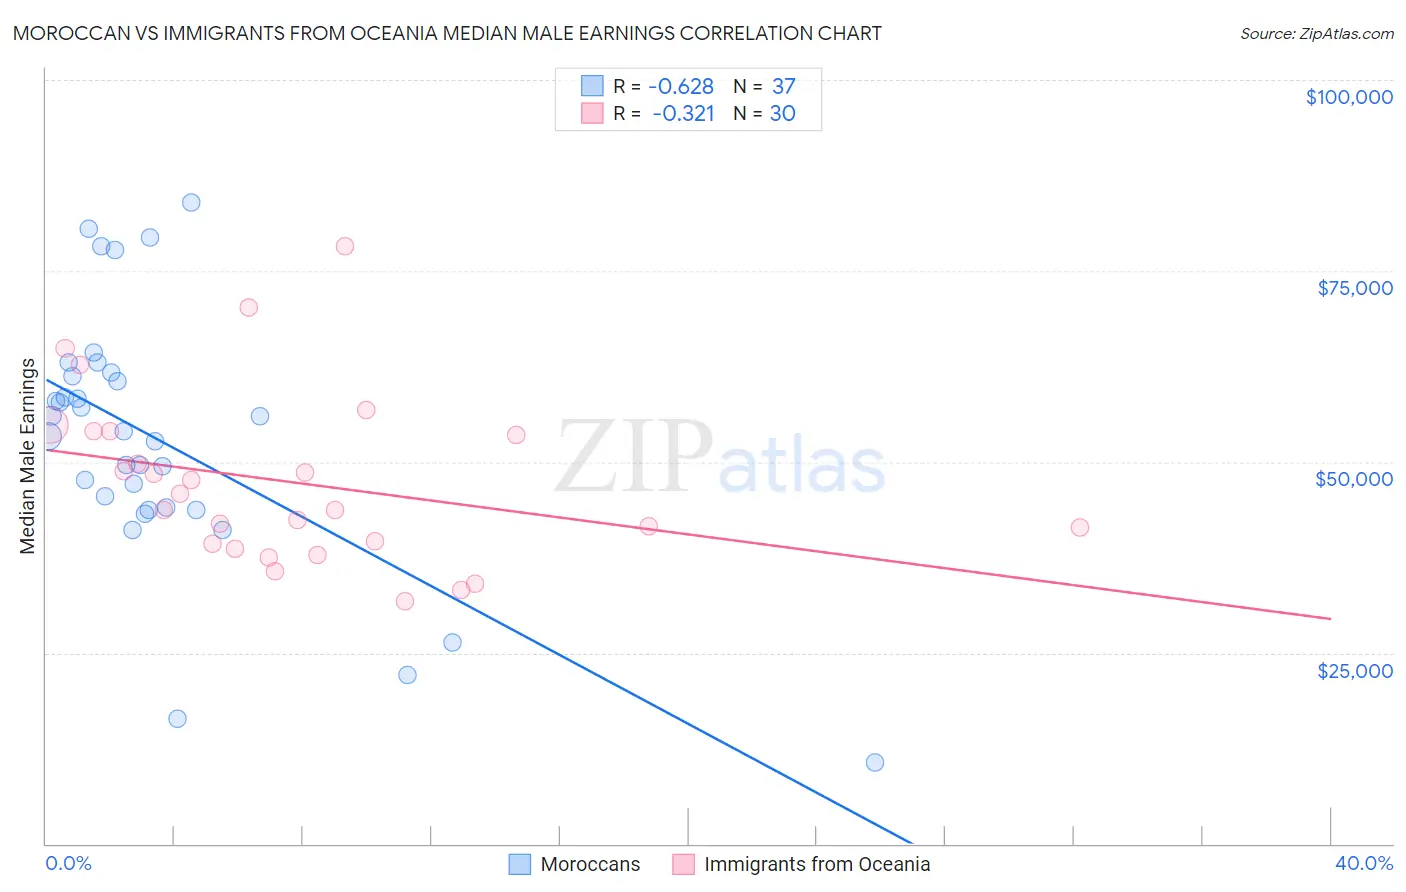
Moroccan vs Immigrants from Oceania Median Male Earnings Correlation Chart
The statistical analysis conducted on geographies consisting of 201,785,575 people shows a significant negative correlation between the proportion of Moroccans and median male earnings in the United States with a correlation coefficient (R) of -0.628 and weighted average of $56,499. Similarly, the statistical analysis conducted on geographies consisting of 305,444,648 people shows a mild negative correlation between the proportion of Immigrants from Oceania and median male earnings in the United States with a correlation coefficient (R) of -0.321 and weighted average of $55,712, a difference of 1.4%.
Median Male Earnings Correlation Summary
| Measurement | Moroccan | Immigrants from Oceania |
| Minimum | $10,662 | $31,736 |
| Maximum | $84,023 | $78,276 |
| Range | $73,361 | $46,540 |
| Mean | $52,885 | $47,354 |
| Median | $54,008 | $44,818 |
| Interquartile 25% (IQ1) | $43,924 | $39,222 |
| Interquartile 75% (IQ3) | $61,434 | $54,011 |
| Interquartile Range (IQR) | $17,511 | $14,789 |
| Standard Deviation (Sample) | $16,590 | $11,148 |
| Standard Deviation (Population) | $16,364 | $10,961 |
Demographics Similar to Moroccans and Immigrants from Oceania by Median Male Earnings
In terms of median male earnings, the demographic groups most similar to Moroccans are Irish ($56,464, a difference of 0.060%), Czech ($56,546, a difference of 0.080%), Immigrants from Germany ($56,542, a difference of 0.080%), Immigrants from Saudi Arabia ($56,452, a difference of 0.080%), and Slavic ($56,390, a difference of 0.19%). Similarly, the demographic groups most similar to Immigrants from Oceania are Swiss ($55,731, a difference of 0.030%), English ($55,747, a difference of 0.060%), Peruvian ($55,659, a difference of 0.10%), Scottish ($55,793, a difference of 0.15%), and Immigrants from Philippines ($55,809, a difference of 0.17%).
| Demographics | Rating | Rank | Median Male Earnings |
| Czechs | 88.2 /100 | #132 | Excellent $56,546 |
| Immigrants | Germany | 88.2 /100 | #133 | Excellent $56,542 |
| Moroccans | 87.7 /100 | #134 | Excellent $56,499 |
| Irish | 87.4 /100 | #135 | Excellent $56,464 |
| Immigrants | Saudi Arabia | 87.2 /100 | #136 | Excellent $56,452 |
| Slavs | 86.5 /100 | #137 | Excellent $56,390 |
| Slovaks | 85.5 /100 | #138 | Excellent $56,306 |
| Zimbabweans | 85.5 /100 | #139 | Excellent $56,302 |
| Luxembourgers | 85.5 /100 | #140 | Excellent $56,300 |
| Danes | 84.8 /100 | #141 | Excellent $56,246 |
| Ethiopians | 84.8 /100 | #142 | Excellent $56,243 |
| Sri Lankans | 83.4 /100 | #143 | Excellent $56,136 |
| Immigrants | Uganda | 82.4 /100 | #144 | Excellent $56,064 |
| Norwegians | 80.9 /100 | #145 | Excellent $55,965 |
| Immigrants | Chile | 80.7 /100 | #146 | Excellent $55,954 |
| Immigrants | Philippines | 78.4 /100 | #147 | Good $55,809 |
| Scottish | 78.2 /100 | #148 | Good $55,793 |
| English | 77.4 /100 | #149 | Good $55,747 |
| Swiss | 77.1 /100 | #150 | Good $55,731 |
| Immigrants | Oceania | 76.8 /100 | #151 | Good $55,712 |
| Peruvians | 75.8 /100 | #152 | Good $55,659 |