Moroccan vs Immigrants from Oceania Unemployment Among Ages 35 to 44 years
COMPARE
Moroccan
Immigrants from Oceania
Unemployment Among Ages 35 to 44 years
Unemployment Among Ages 35 to 44 years Comparison
Moroccans
Immigrants from Oceania
4.9%
UNEMPLOYMENT AMONG AGES 35 TO 44 YEARS
6.0/ 100
METRIC RATING
217th/ 347
METRIC RANK
4.8%
UNEMPLOYMENT AMONG AGES 35 TO 44 YEARS
23.2/ 100
METRIC RATING
197th/ 347
METRIC RANK
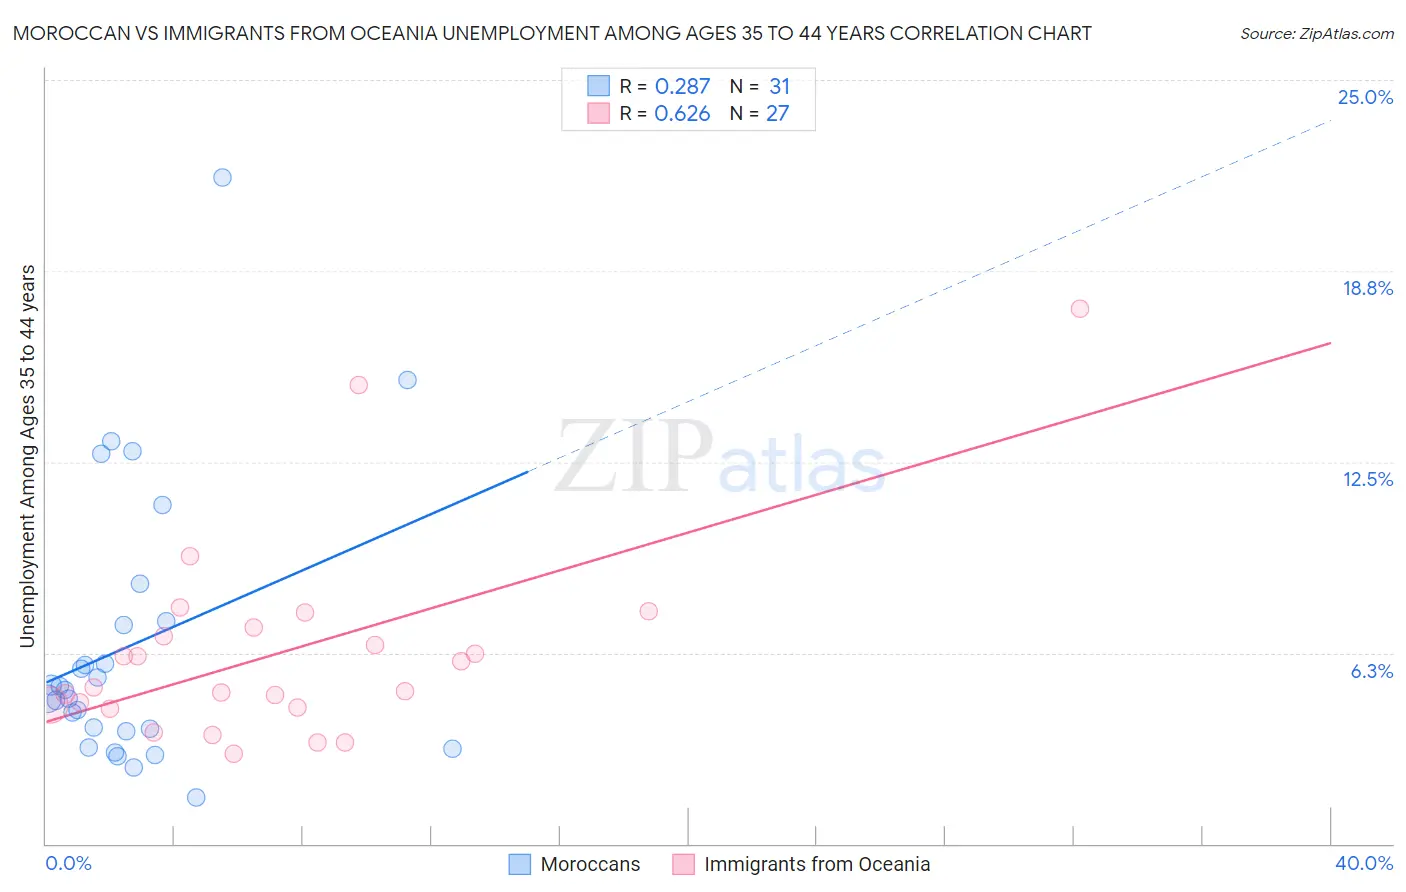
Moroccan vs Immigrants from Oceania Unemployment Among Ages 35 to 44 years Correlation Chart
The statistical analysis conducted on geographies consisting of 200,434,316 people shows a weak positive correlation between the proportion of Moroccans and unemployment rate among population between the ages 35 and 44 in the United States with a correlation coefficient (R) of 0.287 and weighted average of 4.9%. Similarly, the statistical analysis conducted on geographies consisting of 300,000,559 people shows a significant positive correlation between the proportion of Immigrants from Oceania and unemployment rate among population between the ages 35 and 44 in the United States with a correlation coefficient (R) of 0.626 and weighted average of 4.8%, a difference of 2.7%.
Unemployment Among Ages 35 to 44 years Correlation Summary
| Measurement | Moroccan | Immigrants from Oceania |
| Minimum | 1.5% | 2.9% |
| Maximum | 21.8% | 17.5% |
| Range | 20.3% | 14.6% |
| Mean | 6.5% | 6.3% |
| Median | 5.0% | 5.1% |
| Interquartile 25% (IQ1) | 3.7% | 4.5% |
| Interquartile 75% (IQ3) | 7.3% | 7.1% |
| Interquartile Range (IQR) | 3.6% | 2.6% |
| Standard Deviation (Sample) | 4.5% | 3.3% |
| Standard Deviation (Population) | 4.4% | 3.2% |
Demographics Similar to Moroccans and Immigrants from Oceania by Unemployment Among Ages 35 to 44 years
In terms of unemployment among ages 35 to 44 years, the demographic groups most similar to Moroccans are American (4.9%, a difference of 0.040%), Immigrants (4.9%, a difference of 0.51%), Immigrants from Africa (4.9%, a difference of 0.57%), Osage (4.9%, a difference of 0.65%), and Fijian (4.9%, a difference of 0.66%). Similarly, the demographic groups most similar to Immigrants from Oceania are Immigrants from Thailand (4.8%, a difference of 0.030%), Immigrants from Middle Africa (4.8%, a difference of 0.13%), Immigrants from Ukraine (4.8%, a difference of 0.18%), Ugandan (4.8%, a difference of 0.18%), and Immigrants from Afghanistan (4.8%, a difference of 0.30%).
| Demographics | Rating | Rank | Unemployment Among Ages 35 to 44 years |
| Immigrants | Oceania | 23.2 /100 | #197 | Fair 4.8% |
| Immigrants | Thailand | 22.9 /100 | #198 | Fair 4.8% |
| Immigrants | Middle Africa | 21.9 /100 | #199 | Fair 4.8% |
| Immigrants | Ukraine | 21.4 /100 | #200 | Fair 4.8% |
| Ugandans | 21.4 /100 | #201 | Fair 4.8% |
| Immigrants | Afghanistan | 20.2 /100 | #202 | Fair 4.8% |
| Uruguayans | 20.0 /100 | #203 | Fair 4.8% |
| Immigrants | Philippines | 19.8 /100 | #204 | Poor 4.8% |
| Spaniards | 18.7 /100 | #205 | Poor 4.8% |
| Soviet Union | 18.4 /100 | #206 | Poor 4.8% |
| Immigrants | Western Asia | 16.6 /100 | #207 | Poor 4.8% |
| French Canadians | 16.5 /100 | #208 | Poor 4.8% |
| Immigrants | Uruguay | 11.5 /100 | #209 | Poor 4.9% |
| Immigrants | Cameroon | 11.4 /100 | #210 | Poor 4.9% |
| Immigrants | Nonimmigrants | 9.4 /100 | #211 | Tragic 4.9% |
| Fijians | 8.7 /100 | #212 | Tragic 4.9% |
| Osage | 8.6 /100 | #213 | Tragic 4.9% |
| Immigrants | Africa | 8.2 /100 | #214 | Tragic 4.9% |
| Immigrants | Immigrants | 8.0 /100 | #215 | Tragic 4.9% |
| Americans | 6.2 /100 | #216 | Tragic 4.9% |
| Moroccans | 6.0 /100 | #217 | Tragic 4.9% |