Estonian vs Immigrants from Laos Median Male Earnings
COMPARE
Estonian
Immigrants from Laos
Median Male Earnings
Median Male Earnings Comparison
Estonians
Immigrants from Laos
$61,710
MEDIAN MALE EARNINGS
99.9/ 100
METRIC RATING
51st/ 347
METRIC RANK
$49,190
MEDIAN MALE EARNINGS
0.6/ 100
METRIC RATING
265th/ 347
METRIC RANK
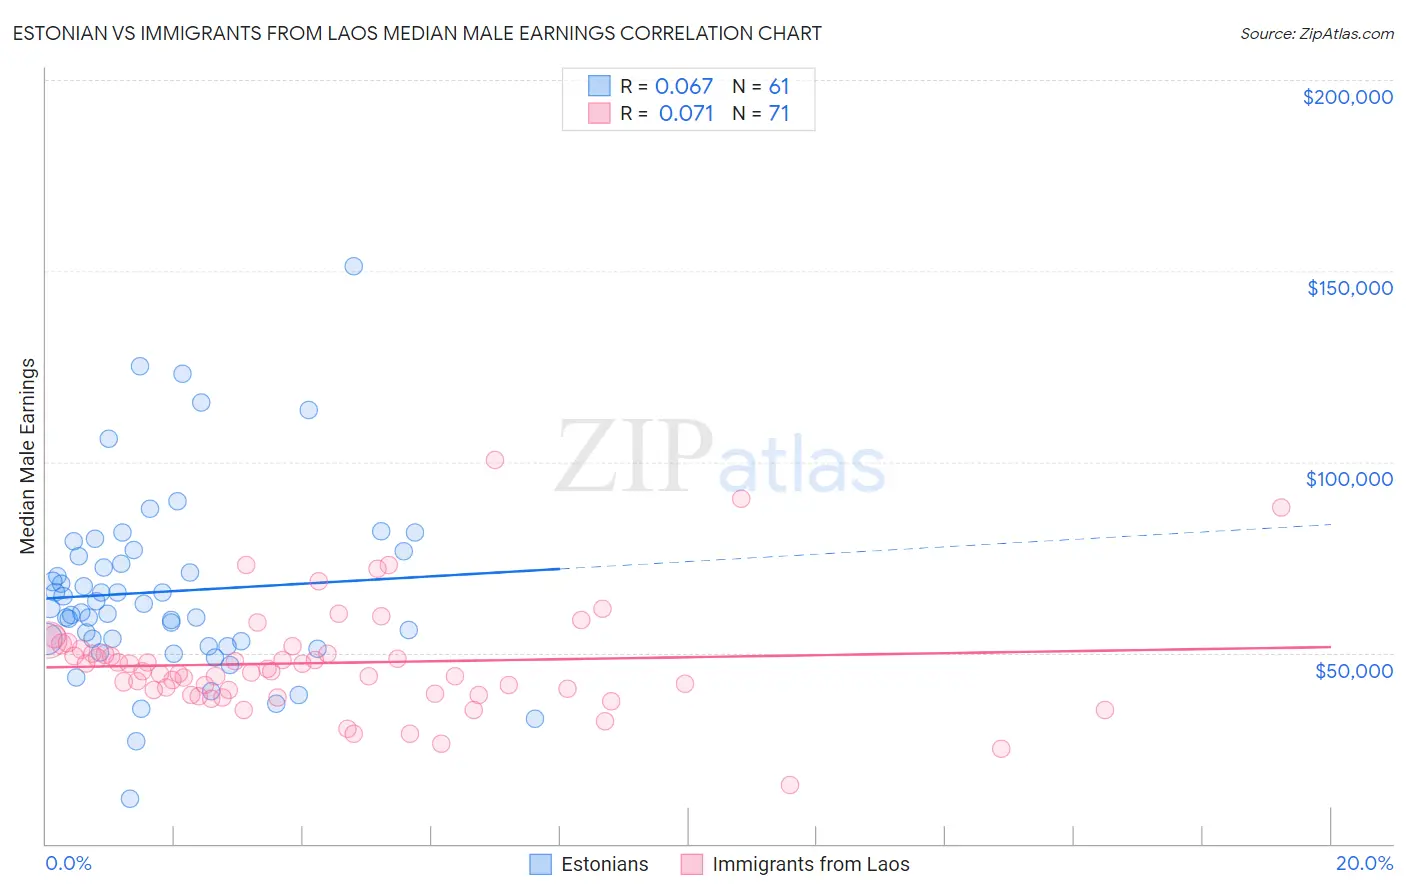
Estonian vs Immigrants from Laos Median Male Earnings Correlation Chart
The statistical analysis conducted on geographies consisting of 123,512,238 people shows a slight positive correlation between the proportion of Estonians and median male earnings in the United States with a correlation coefficient (R) of 0.067 and weighted average of $61,710. Similarly, the statistical analysis conducted on geographies consisting of 201,459,806 people shows a slight positive correlation between the proportion of Immigrants from Laos and median male earnings in the United States with a correlation coefficient (R) of 0.071 and weighted average of $49,190, a difference of 25.5%.
Median Male Earnings Correlation Summary
| Measurement | Estonian | Immigrants from Laos |
| Minimum | $11,700 | $15,268 |
| Maximum | $151,311 | $100,625 |
| Range | $139,611 | $85,357 |
| Mean | $66,018 | $47,381 |
| Median | $61,673 | $45,153 |
| Interquartile 25% (IQ1) | $52,472 | $39,274 |
| Interquartile 75% (IQ3) | $76,012 | $50,916 |
| Interquartile Range (IQR) | $23,541 | $11,642 |
| Standard Deviation (Sample) | $24,287 | $14,342 |
| Standard Deviation (Population) | $24,087 | $14,241 |
Similar Demographics by Median Male Earnings
Demographics Similar to Estonians by Median Male Earnings
In terms of median male earnings, the demographic groups most similar to Estonians are Bhutanese ($61,759, a difference of 0.080%), Immigrants from Norway ($61,628, a difference of 0.13%), South African ($61,460, a difference of 0.41%), Immigrants from Latvia ($61,422, a difference of 0.47%), and Immigrants from Europe ($62,057, a difference of 0.56%).
| Demographics | Rating | Rank | Median Male Earnings |
| Cambodians | 100.0 /100 | #44 | Exceptional $62,516 |
| Bulgarians | 100.0 /100 | #45 | Exceptional $62,378 |
| Immigrants | Czechoslovakia | 99.9 /100 | #46 | Exceptional $62,217 |
| Immigrants | Austria | 99.9 /100 | #47 | Exceptional $62,164 |
| Immigrants | Malaysia | 99.9 /100 | #48 | Exceptional $62,121 |
| Immigrants | Europe | 99.9 /100 | #49 | Exceptional $62,057 |
| Bhutanese | 99.9 /100 | #50 | Exceptional $61,759 |
| Estonians | 99.9 /100 | #51 | Exceptional $61,710 |
| Immigrants | Norway | 99.9 /100 | #52 | Exceptional $61,628 |
| South Africans | 99.9 /100 | #53 | Exceptional $61,460 |
| Immigrants | Latvia | 99.9 /100 | #54 | Exceptional $61,422 |
| Greeks | 99.9 /100 | #55 | Exceptional $61,242 |
| Lithuanians | 99.9 /100 | #56 | Exceptional $61,228 |
| Immigrants | Scotland | 99.9 /100 | #57 | Exceptional $61,220 |
| New Zealanders | 99.9 /100 | #58 | Exceptional $61,199 |
Demographics Similar to Immigrants from Laos by Median Male Earnings
In terms of median male earnings, the demographic groups most similar to Immigrants from Laos are Immigrants from Middle Africa ($49,201, a difference of 0.020%), Nicaraguan ($49,215, a difference of 0.050%), Immigrants from West Indies ($49,271, a difference of 0.16%), Liberian ($49,318, a difference of 0.26%), and Somali ($49,025, a difference of 0.34%).
| Demographics | Rating | Rank | Median Male Earnings |
| Cree | 0.7 /100 | #258 | Tragic $49,497 |
| Nepalese | 0.7 /100 | #259 | Tragic $49,458 |
| Iroquois | 0.7 /100 | #260 | Tragic $49,374 |
| Liberians | 0.6 /100 | #261 | Tragic $49,318 |
| Immigrants | West Indies | 0.6 /100 | #262 | Tragic $49,271 |
| Nicaraguans | 0.6 /100 | #263 | Tragic $49,215 |
| Immigrants | Middle Africa | 0.6 /100 | #264 | Tragic $49,201 |
| Immigrants | Laos | 0.6 /100 | #265 | Tragic $49,190 |
| Somalis | 0.5 /100 | #266 | Tragic $49,025 |
| Spanish Americans | 0.5 /100 | #267 | Tragic $49,008 |
| Ute | 0.4 /100 | #268 | Tragic $48,899 |
| Tsimshian | 0.4 /100 | #269 | Tragic $48,836 |
| Potawatomi | 0.4 /100 | #270 | Tragic $48,768 |
| Cherokee | 0.3 /100 | #271 | Tragic $48,669 |
| Salvadorans | 0.3 /100 | #272 | Tragic $48,646 |