Menominee vs Latvian Per Capita Income
COMPARE
Menominee
Latvian
Per Capita Income
Per Capita Income Comparison
Menominee
Latvians
$34,578
PER CAPITA INCOME
0.0/ 100
METRIC RATING
328th/ 347
METRIC RANK
$52,649
PER CAPITA INCOME
100.0/ 100
METRIC RATING
28th/ 347
METRIC RANK
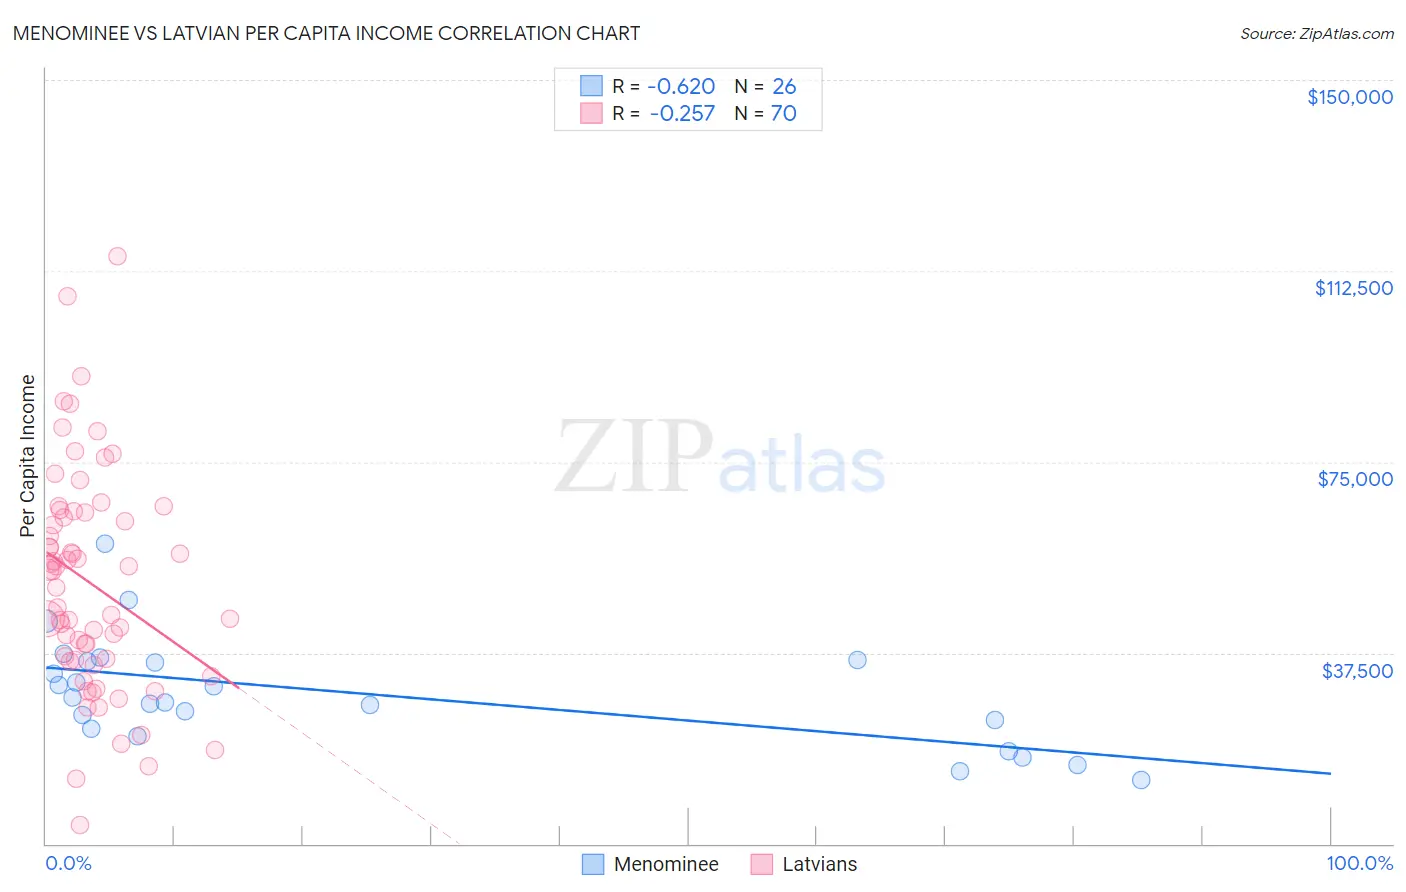
Menominee vs Latvian Per Capita Income Correlation Chart
The statistical analysis conducted on geographies consisting of 45,778,979 people shows a significant negative correlation between the proportion of Menominee and per capita income in the United States with a correlation coefficient (R) of -0.620 and weighted average of $34,578. Similarly, the statistical analysis conducted on geographies consisting of 220,728,386 people shows a weak negative correlation between the proportion of Latvians and per capita income in the United States with a correlation coefficient (R) of -0.257 and weighted average of $52,649, a difference of 52.3%.
Per Capita Income Correlation Summary
| Measurement | Menominee | Latvian |
| Minimum | $12,454 | $3,646 |
| Maximum | $58,872 | $115,504 |
| Range | $46,418 | $111,858 |
| Mean | $29,500 | $51,165 |
| Median | $28,225 | $52,046 |
| Interquartile 25% (IQ1) | $22,568 | $36,086 |
| Interquartile 75% (IQ3) | $35,908 | $65,124 |
| Interquartile Range (IQR) | $13,340 | $29,038 |
| Standard Deviation (Sample) | $10,696 | $21,773 |
| Standard Deviation (Population) | $10,488 | $21,617 |
Similar Demographics by Per Capita Income
Demographics Similar to Menominee by Per Capita Income
In terms of per capita income, the demographic groups most similar to Menominee are Mexican ($34,559, a difference of 0.060%), Apache ($34,886, a difference of 0.89%), Immigrants from Cuba ($34,910, a difference of 0.96%), Spanish American Indian ($34,195, a difference of 1.1%), and Immigrants from Central America ($34,974, a difference of 1.1%).
| Demographics | Rating | Rank | Per Capita Income |
| Blacks/African Americans | 0.0 /100 | #321 | Tragic $35,564 |
| Creek | 0.0 /100 | #322 | Tragic $35,546 |
| Cheyenne | 0.0 /100 | #323 | Tragic $35,276 |
| Kiowa | 0.0 /100 | #324 | Tragic $35,102 |
| Immigrants | Central America | 0.0 /100 | #325 | Tragic $34,974 |
| Immigrants | Cuba | 0.0 /100 | #326 | Tragic $34,910 |
| Apache | 0.0 /100 | #327 | Tragic $34,886 |
| Menominee | 0.0 /100 | #328 | Tragic $34,578 |
| Mexicans | 0.0 /100 | #329 | Tragic $34,559 |
| Spanish American Indians | 0.0 /100 | #330 | Tragic $34,195 |
| Immigrants | Mexico | 0.0 /100 | #331 | Tragic $33,931 |
| Sioux | 0.0 /100 | #332 | Tragic $33,921 |
| Immigrants | Yemen | 0.0 /100 | #333 | Tragic $33,696 |
| Natives/Alaskans | 0.0 /100 | #334 | Tragic $33,279 |
| Yuman | 0.0 /100 | #335 | Tragic $33,236 |
Demographics Similar to Latvians by Per Capita Income
In terms of per capita income, the demographic groups most similar to Latvians are Immigrants from South Central Asia ($52,660, a difference of 0.020%), Israeli ($52,596, a difference of 0.10%), Immigrants from Austria ($52,503, a difference of 0.28%), Turkish ($52,391, a difference of 0.49%), and Immigrants from Norway ($52,217, a difference of 0.83%).
| Demographics | Rating | Rank | Per Capita Income |
| Immigrants | Northern Europe | 100.0 /100 | #21 | Exceptional $54,159 |
| Indians (Asian) | 100.0 /100 | #22 | Exceptional $53,874 |
| Immigrants | Eastern Asia | 100.0 /100 | #23 | Exceptional $53,806 |
| Immigrants | Denmark | 100.0 /100 | #24 | Exceptional $53,799 |
| Immigrants | Japan | 100.0 /100 | #25 | Exceptional $53,359 |
| Russians | 100.0 /100 | #26 | Exceptional $53,154 |
| Immigrants | South Central Asia | 100.0 /100 | #27 | Exceptional $52,660 |
| Latvians | 100.0 /100 | #28 | Exceptional $52,649 |
| Israelis | 100.0 /100 | #29 | Exceptional $52,596 |
| Immigrants | Austria | 100.0 /100 | #30 | Exceptional $52,503 |
| Turks | 100.0 /100 | #31 | Exceptional $52,391 |
| Immigrants | Norway | 100.0 /100 | #32 | Exceptional $52,217 |
| Australians | 100.0 /100 | #33 | Exceptional $52,074 |
| Immigrants | Russia | 100.0 /100 | #34 | Exceptional $52,044 |
| Burmese | 100.0 /100 | #35 | Exceptional $52,005 |