Menominee vs Immigrants from Germany Per Capita Income
COMPARE
Menominee
Immigrants from Germany
Per Capita Income
Per Capita Income Comparison
Menominee
Immigrants from Germany
$34,578
PER CAPITA INCOME
0.0/ 100
METRIC RATING
328th/ 347
METRIC RANK
$45,751
PER CAPITA INCOME
91.3/ 100
METRIC RATING
127th/ 347
METRIC RANK
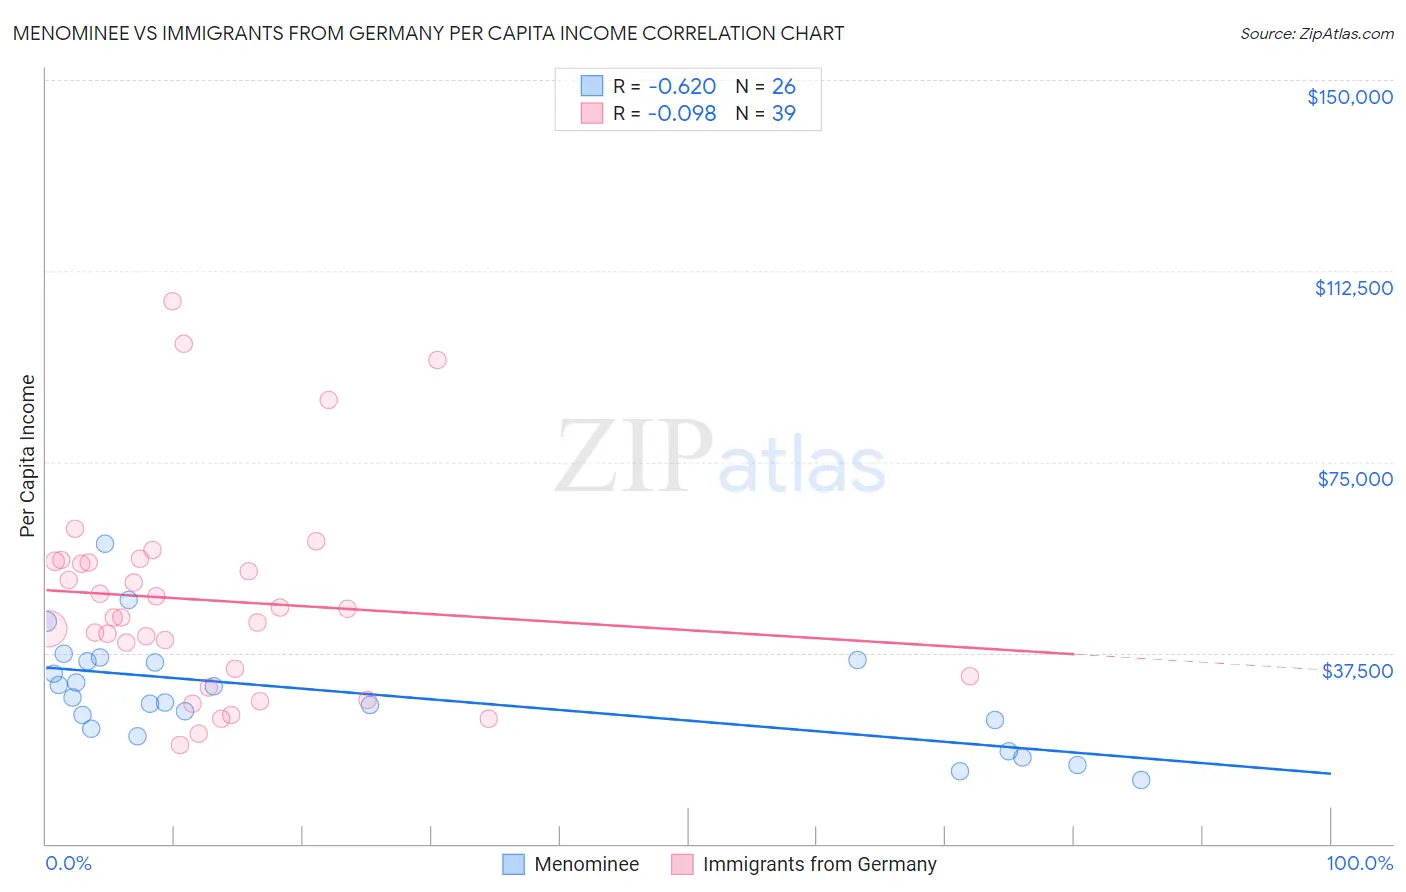
Menominee vs Immigrants from Germany Per Capita Income Correlation Chart
The statistical analysis conducted on geographies consisting of 45,778,979 people shows a significant negative correlation between the proportion of Menominee and per capita income in the United States with a correlation coefficient (R) of -0.620 and weighted average of $34,578. Similarly, the statistical analysis conducted on geographies consisting of 463,898,714 people shows a slight negative correlation between the proportion of Immigrants from Germany and per capita income in the United States with a correlation coefficient (R) of -0.098 and weighted average of $45,751, a difference of 32.3%.
Per Capita Income Correlation Summary
| Measurement | Menominee | Immigrants from Germany |
| Minimum | $12,454 | $19,389 |
| Maximum | $58,872 | $106,492 |
| Range | $46,418 | $87,103 |
| Mean | $29,500 | $47,817 |
| Median | $28,225 | $44,537 |
| Interquartile 25% (IQ1) | $22,568 | $32,967 |
| Interquartile 75% (IQ3) | $35,908 | $55,483 |
| Interquartile Range (IQR) | $13,340 | $22,516 |
| Standard Deviation (Sample) | $10,696 | $20,412 |
| Standard Deviation (Population) | $10,488 | $20,149 |
Similar Demographics by Per Capita Income
Demographics Similar to Menominee by Per Capita Income
In terms of per capita income, the demographic groups most similar to Menominee are Mexican ($34,559, a difference of 0.060%), Apache ($34,886, a difference of 0.89%), Immigrants from Cuba ($34,910, a difference of 0.96%), Spanish American Indian ($34,195, a difference of 1.1%), and Immigrants from Central America ($34,974, a difference of 1.1%).
| Demographics | Rating | Rank | Per Capita Income |
| Blacks/African Americans | 0.0 /100 | #321 | Tragic $35,564 |
| Creek | 0.0 /100 | #322 | Tragic $35,546 |
| Cheyenne | 0.0 /100 | #323 | Tragic $35,276 |
| Kiowa | 0.0 /100 | #324 | Tragic $35,102 |
| Immigrants | Central America | 0.0 /100 | #325 | Tragic $34,974 |
| Immigrants | Cuba | 0.0 /100 | #326 | Tragic $34,910 |
| Apache | 0.0 /100 | #327 | Tragic $34,886 |
| Menominee | 0.0 /100 | #328 | Tragic $34,578 |
| Mexicans | 0.0 /100 | #329 | Tragic $34,559 |
| Spanish American Indians | 0.0 /100 | #330 | Tragic $34,195 |
| Immigrants | Mexico | 0.0 /100 | #331 | Tragic $33,931 |
| Sioux | 0.0 /100 | #332 | Tragic $33,921 |
| Immigrants | Yemen | 0.0 /100 | #333 | Tragic $33,696 |
| Natives/Alaskans | 0.0 /100 | #334 | Tragic $33,279 |
| Yuman | 0.0 /100 | #335 | Tragic $33,236 |
Demographics Similar to Immigrants from Germany by Per Capita Income
In terms of per capita income, the demographic groups most similar to Immigrants from Germany are Swedish ($45,750, a difference of 0.0%), Palestinian ($45,790, a difference of 0.090%), Zimbabwean ($45,804, a difference of 0.12%), European ($45,836, a difference of 0.19%), and Luxembourger ($45,663, a difference of 0.19%).
| Demographics | Rating | Rank | Per Capita Income |
| Immigrants | Ethiopia | 92.7 /100 | #120 | Exceptional $45,923 |
| Canadians | 92.2 /100 | #121 | Exceptional $45,858 |
| Moroccans | 92.1 /100 | #122 | Exceptional $45,854 |
| Lebanese | 92.0 /100 | #123 | Exceptional $45,840 |
| Europeans | 92.0 /100 | #124 | Exceptional $45,836 |
| Zimbabweans | 91.7 /100 | #125 | Exceptional $45,804 |
| Palestinians | 91.6 /100 | #126 | Exceptional $45,790 |
| Immigrants | Germany | 91.3 /100 | #127 | Exceptional $45,751 |
| Swedes | 91.3 /100 | #128 | Exceptional $45,750 |
| Luxembourgers | 90.4 /100 | #129 | Exceptional $45,663 |
| Arabs | 90.4 /100 | #130 | Exceptional $45,662 |
| Immigrants | North Macedonia | 90.0 /100 | #131 | Exceptional $45,622 |
| Jordanians | 89.9 /100 | #132 | Excellent $45,605 |
| Pakistanis | 89.7 /100 | #133 | Excellent $45,587 |
| Slovenes | 89.6 /100 | #134 | Excellent $45,581 |