Menominee vs Burmese Per Capita Income
COMPARE
Menominee
Burmese
Per Capita Income
Per Capita Income Comparison
Menominee
Burmese
$34,578
PER CAPITA INCOME
0.0/ 100
METRIC RATING
328th/ 347
METRIC RANK
$52,005
PER CAPITA INCOME
100.0/ 100
METRIC RATING
35th/ 347
METRIC RANK
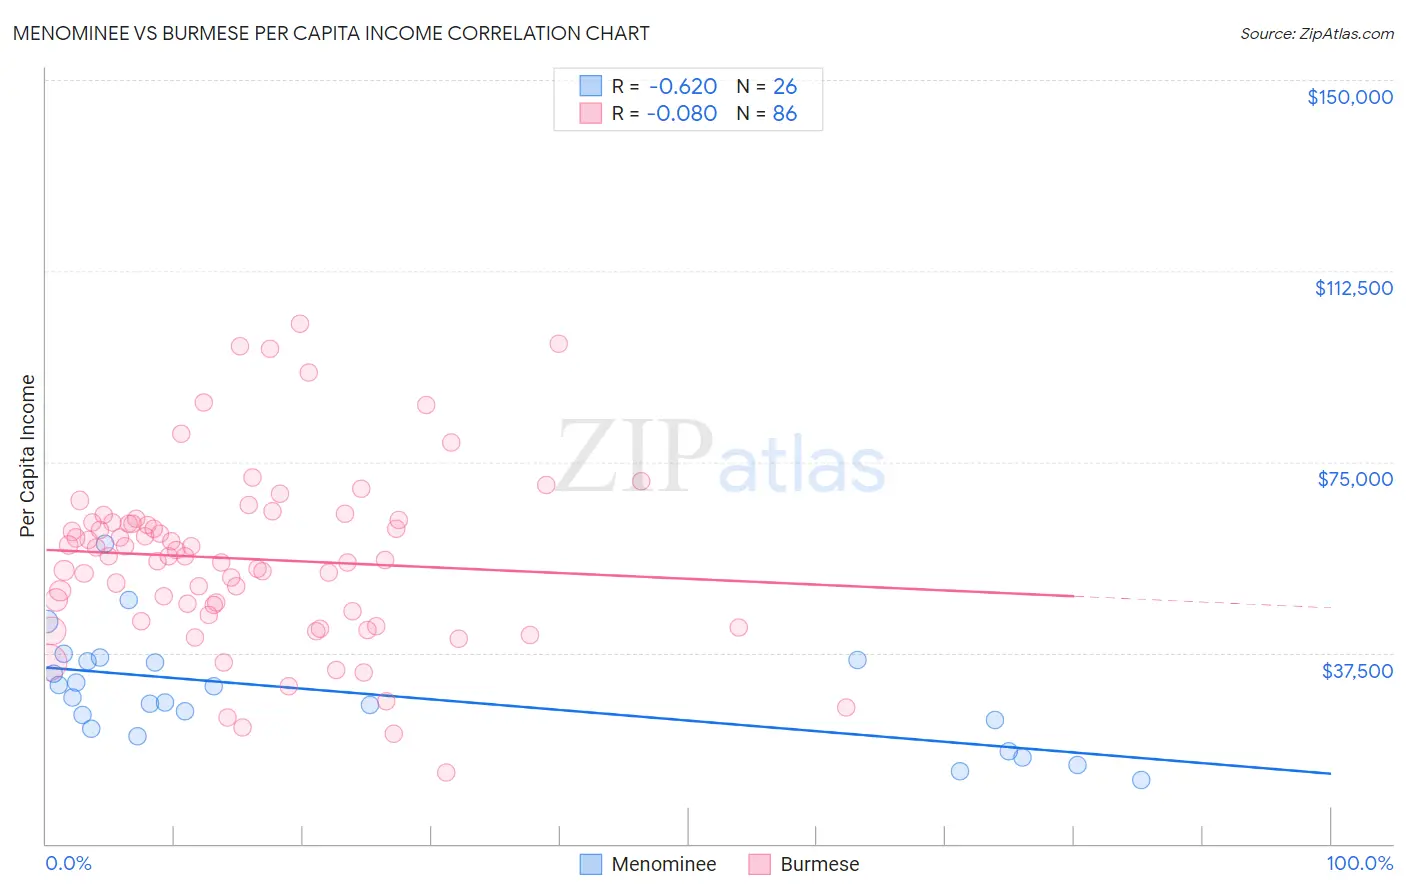
Menominee vs Burmese Per Capita Income Correlation Chart
The statistical analysis conducted on geographies consisting of 45,778,979 people shows a significant negative correlation between the proportion of Menominee and per capita income in the United States with a correlation coefficient (R) of -0.620 and weighted average of $34,578. Similarly, the statistical analysis conducted on geographies consisting of 465,453,233 people shows a slight negative correlation between the proportion of Burmese and per capita income in the United States with a correlation coefficient (R) of -0.080 and weighted average of $52,005, a difference of 50.4%.
Per Capita Income Correlation Summary
| Measurement | Menominee | Burmese |
| Minimum | $12,454 | $14,082 |
| Maximum | $58,872 | $102,113 |
| Range | $46,418 | $88,031 |
| Mean | $29,500 | $55,927 |
| Median | $28,225 | $56,416 |
| Interquartile 25% (IQ1) | $22,568 | $45,035 |
| Interquartile 75% (IQ3) | $35,908 | $63,196 |
| Interquartile Range (IQR) | $13,340 | $18,162 |
| Standard Deviation (Sample) | $10,696 | $17,378 |
| Standard Deviation (Population) | $10,488 | $17,276 |
Similar Demographics by Per Capita Income
Demographics Similar to Menominee by Per Capita Income
In terms of per capita income, the demographic groups most similar to Menominee are Mexican ($34,559, a difference of 0.060%), Apache ($34,886, a difference of 0.89%), Immigrants from Cuba ($34,910, a difference of 0.96%), Spanish American Indian ($34,195, a difference of 1.1%), and Immigrants from Central America ($34,974, a difference of 1.1%).
| Demographics | Rating | Rank | Per Capita Income |
| Blacks/African Americans | 0.0 /100 | #321 | Tragic $35,564 |
| Creek | 0.0 /100 | #322 | Tragic $35,546 |
| Cheyenne | 0.0 /100 | #323 | Tragic $35,276 |
| Kiowa | 0.0 /100 | #324 | Tragic $35,102 |
| Immigrants | Central America | 0.0 /100 | #325 | Tragic $34,974 |
| Immigrants | Cuba | 0.0 /100 | #326 | Tragic $34,910 |
| Apache | 0.0 /100 | #327 | Tragic $34,886 |
| Menominee | 0.0 /100 | #328 | Tragic $34,578 |
| Mexicans | 0.0 /100 | #329 | Tragic $34,559 |
| Spanish American Indians | 0.0 /100 | #330 | Tragic $34,195 |
| Immigrants | Mexico | 0.0 /100 | #331 | Tragic $33,931 |
| Sioux | 0.0 /100 | #332 | Tragic $33,921 |
| Immigrants | Yemen | 0.0 /100 | #333 | Tragic $33,696 |
| Natives/Alaskans | 0.0 /100 | #334 | Tragic $33,279 |
| Yuman | 0.0 /100 | #335 | Tragic $33,236 |
Demographics Similar to Burmese by Per Capita Income
In terms of per capita income, the demographic groups most similar to Burmese are Immigrants from Russia ($52,044, a difference of 0.070%), Australian ($52,074, a difference of 0.13%), Immigrants from Greece ($51,891, a difference of 0.22%), Estonian ($51,875, a difference of 0.25%), and Immigrants from Norway ($52,217, a difference of 0.41%).
| Demographics | Rating | Rank | Per Capita Income |
| Latvians | 100.0 /100 | #28 | Exceptional $52,649 |
| Israelis | 100.0 /100 | #29 | Exceptional $52,596 |
| Immigrants | Austria | 100.0 /100 | #30 | Exceptional $52,503 |
| Turks | 100.0 /100 | #31 | Exceptional $52,391 |
| Immigrants | Norway | 100.0 /100 | #32 | Exceptional $52,217 |
| Australians | 100.0 /100 | #33 | Exceptional $52,074 |
| Immigrants | Russia | 100.0 /100 | #34 | Exceptional $52,044 |
| Burmese | 100.0 /100 | #35 | Exceptional $52,005 |
| Immigrants | Greece | 100.0 /100 | #36 | Exceptional $51,891 |
| Estonians | 100.0 /100 | #37 | Exceptional $51,875 |
| Immigrants | Czechoslovakia | 100.0 /100 | #38 | Exceptional $51,770 |
| Cambodians | 100.0 /100 | #39 | Exceptional $51,731 |
| Immigrants | Korea | 100.0 /100 | #40 | Exceptional $51,671 |
| Immigrants | South Africa | 100.0 /100 | #41 | Exceptional $51,465 |
| Immigrants | Turkey | 100.0 /100 | #42 | Exceptional $51,368 |