Menominee vs Immigrants from Canada Per Capita Income
COMPARE
Menominee
Immigrants from Canada
Per Capita Income
Per Capita Income Comparison
Menominee
Immigrants from Canada
$34,578
PER CAPITA INCOME
0.0/ 100
METRIC RATING
328th/ 347
METRIC RANK
$49,412
PER CAPITA INCOME
99.8/ 100
METRIC RATING
69th/ 347
METRIC RANK
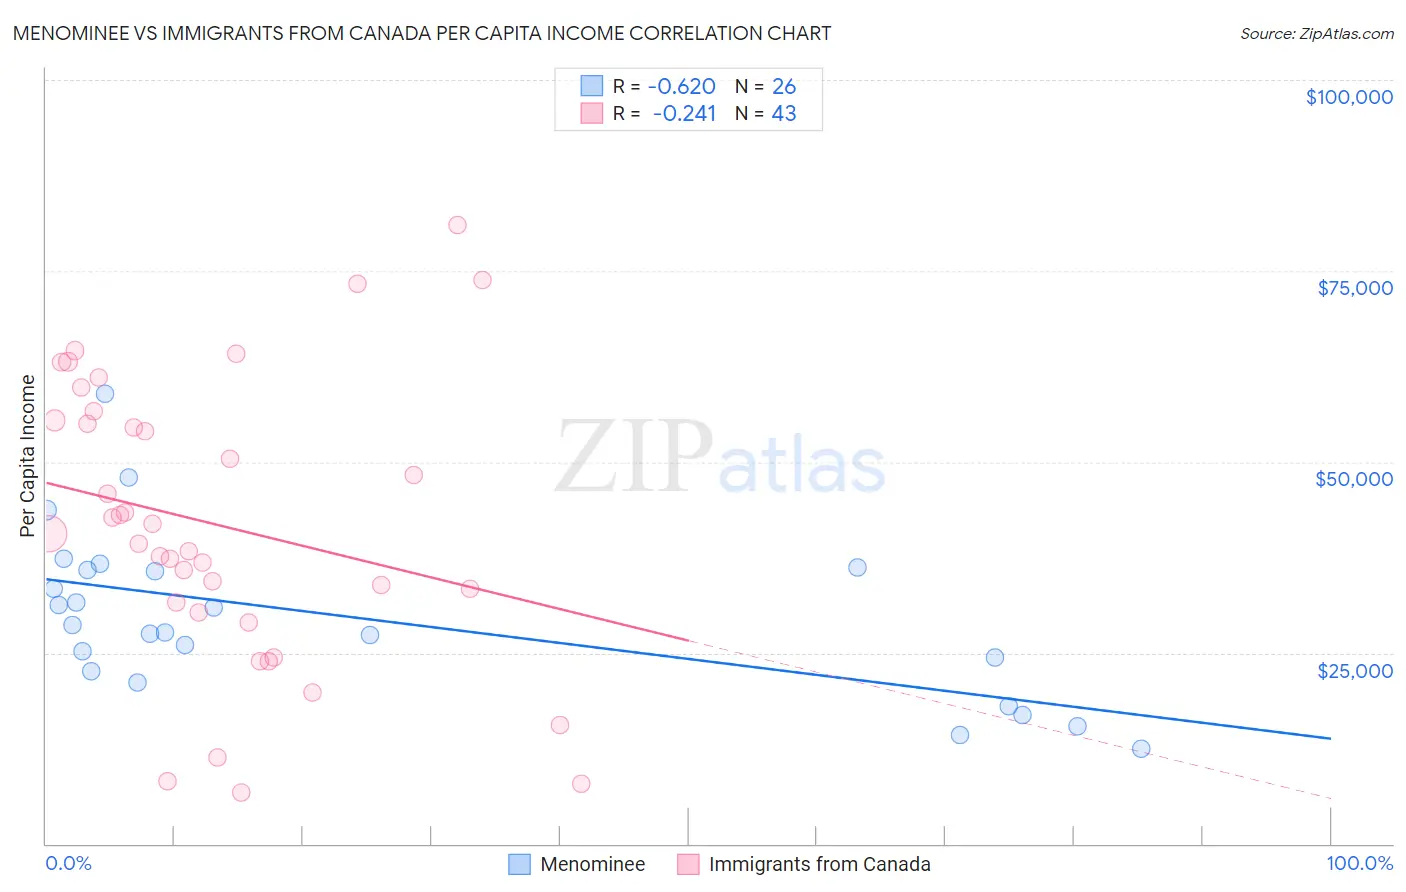
Menominee vs Immigrants from Canada Per Capita Income Correlation Chart
The statistical analysis conducted on geographies consisting of 45,778,979 people shows a significant negative correlation between the proportion of Menominee and per capita income in the United States with a correlation coefficient (R) of -0.620 and weighted average of $34,578. Similarly, the statistical analysis conducted on geographies consisting of 459,409,712 people shows a weak negative correlation between the proportion of Immigrants from Canada and per capita income in the United States with a correlation coefficient (R) of -0.241 and weighted average of $49,412, a difference of 42.9%.
Per Capita Income Correlation Summary
| Measurement | Menominee | Immigrants from Canada |
| Minimum | $12,454 | $6,700 |
| Maximum | $58,872 | $80,940 |
| Range | $46,418 | $74,240 |
| Mean | $29,500 | $41,746 |
| Median | $28,225 | $40,519 |
| Interquartile 25% (IQ1) | $22,568 | $30,302 |
| Interquartile 75% (IQ3) | $35,908 | $55,434 |
| Interquartile Range (IQR) | $13,340 | $25,132 |
| Standard Deviation (Sample) | $10,696 | $18,564 |
| Standard Deviation (Population) | $10,488 | $18,346 |
Similar Demographics by Per Capita Income
Demographics Similar to Menominee by Per Capita Income
In terms of per capita income, the demographic groups most similar to Menominee are Mexican ($34,559, a difference of 0.060%), Apache ($34,886, a difference of 0.89%), Immigrants from Cuba ($34,910, a difference of 0.96%), Spanish American Indian ($34,195, a difference of 1.1%), and Immigrants from Central America ($34,974, a difference of 1.1%).
| Demographics | Rating | Rank | Per Capita Income |
| Blacks/African Americans | 0.0 /100 | #321 | Tragic $35,564 |
| Creek | 0.0 /100 | #322 | Tragic $35,546 |
| Cheyenne | 0.0 /100 | #323 | Tragic $35,276 |
| Kiowa | 0.0 /100 | #324 | Tragic $35,102 |
| Immigrants | Central America | 0.0 /100 | #325 | Tragic $34,974 |
| Immigrants | Cuba | 0.0 /100 | #326 | Tragic $34,910 |
| Apache | 0.0 /100 | #327 | Tragic $34,886 |
| Menominee | 0.0 /100 | #328 | Tragic $34,578 |
| Mexicans | 0.0 /100 | #329 | Tragic $34,559 |
| Spanish American Indians | 0.0 /100 | #330 | Tragic $34,195 |
| Immigrants | Mexico | 0.0 /100 | #331 | Tragic $33,931 |
| Sioux | 0.0 /100 | #332 | Tragic $33,921 |
| Immigrants | Yemen | 0.0 /100 | #333 | Tragic $33,696 |
| Natives/Alaskans | 0.0 /100 | #334 | Tragic $33,279 |
| Yuman | 0.0 /100 | #335 | Tragic $33,236 |
Demographics Similar to Immigrants from Canada by Per Capita Income
In terms of per capita income, the demographic groups most similar to Immigrants from Canada are Lithuanian ($49,448, a difference of 0.070%), Immigrants from Romania ($49,463, a difference of 0.10%), Immigrants from Bulgaria ($49,482, a difference of 0.14%), Immigrants from Eastern Europe ($49,316, a difference of 0.20%), and Greek ($49,309, a difference of 0.21%).
| Demographics | Rating | Rank | Per Capita Income |
| Immigrants | Asia | 99.9 /100 | #62 | Exceptional $49,741 |
| Maltese | 99.9 /100 | #63 | Exceptional $49,640 |
| Immigrants | Argentina | 99.9 /100 | #64 | Exceptional $49,627 |
| Bolivians | 99.9 /100 | #65 | Exceptional $49,526 |
| Immigrants | Bulgaria | 99.9 /100 | #66 | Exceptional $49,482 |
| Immigrants | Romania | 99.9 /100 | #67 | Exceptional $49,463 |
| Lithuanians | 99.8 /100 | #68 | Exceptional $49,448 |
| Immigrants | Canada | 99.8 /100 | #69 | Exceptional $49,412 |
| Immigrants | Eastern Europe | 99.8 /100 | #70 | Exceptional $49,316 |
| Greeks | 99.8 /100 | #71 | Exceptional $49,309 |
| Immigrants | Hungary | 99.8 /100 | #72 | Exceptional $49,303 |
| Immigrants | North America | 99.8 /100 | #73 | Exceptional $49,302 |
| Mongolians | 99.8 /100 | #74 | Exceptional $49,173 |
| Immigrants | Bolivia | 99.7 /100 | #75 | Exceptional $48,970 |
| Immigrants | England | 99.7 /100 | #76 | Exceptional $48,844 |