Menominee vs Latvian Male Unemployment
COMPARE
Menominee
Latvian
Male Unemployment
Male Unemployment Comparison
Menominee
Latvians
6.0%
MALE UNEMPLOYMENT
0.0/ 100
METRIC RATING
275th/ 347
METRIC RANK
4.8%
MALE UNEMPLOYMENT
99.7/ 100
METRIC RATING
33rd/ 347
METRIC RANK
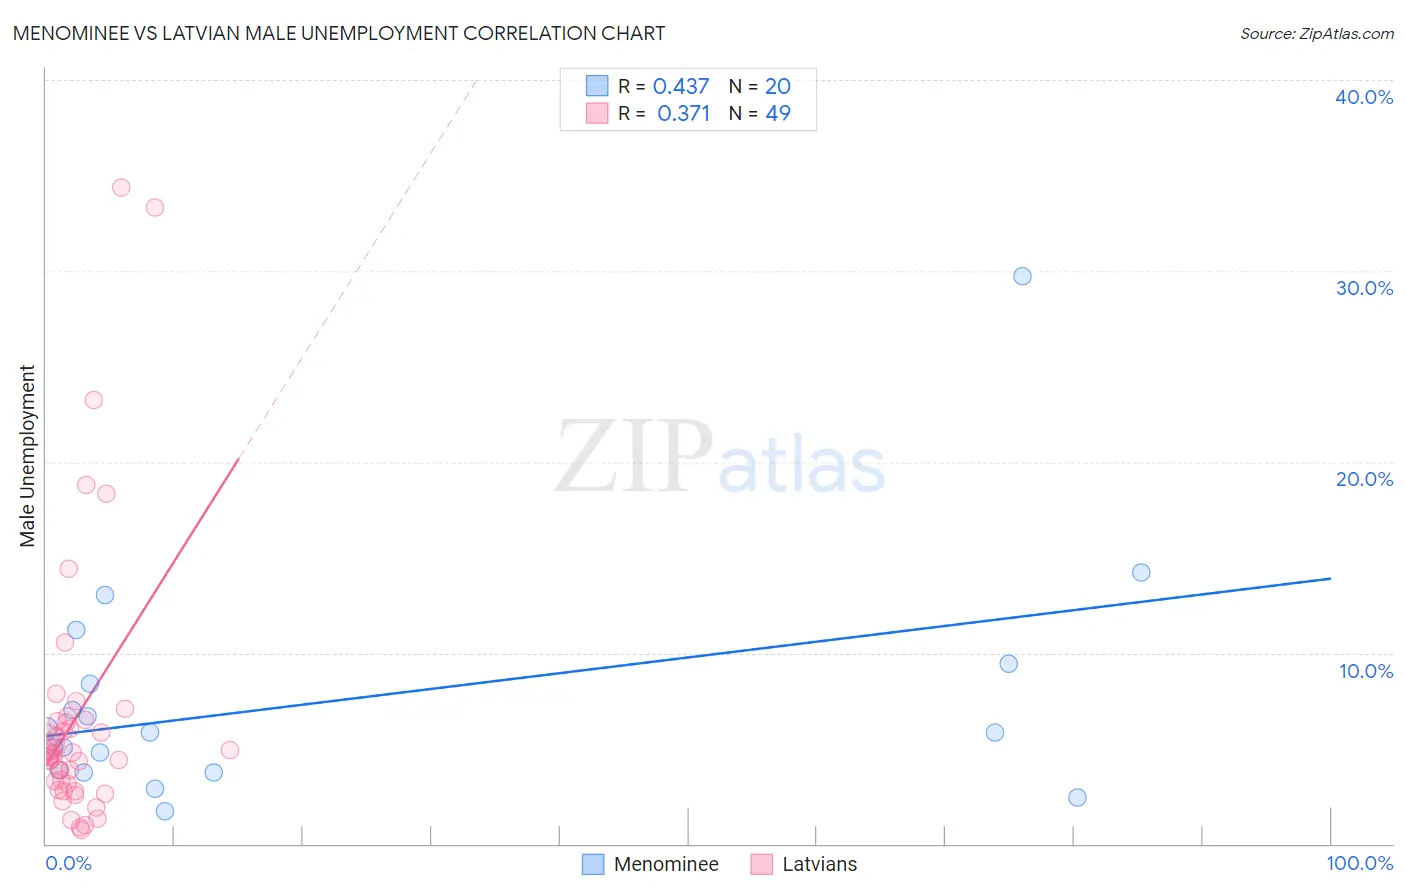
Menominee vs Latvian Male Unemployment Correlation Chart
The statistical analysis conducted on geographies consisting of 45,696,214 people shows a moderate positive correlation between the proportion of Menominee and unemployment rate among males in the United States with a correlation coefficient (R) of 0.437 and weighted average of 6.0%. Similarly, the statistical analysis conducted on geographies consisting of 220,207,220 people shows a mild positive correlation between the proportion of Latvians and unemployment rate among males in the United States with a correlation coefficient (R) of 0.371 and weighted average of 4.8%, a difference of 24.3%.
Male Unemployment Correlation Summary
| Measurement | Menominee | Latvian |
| Minimum | 1.7% | 0.70% |
| Maximum | 29.7% | 34.4% |
| Range | 28.0% | 33.7% |
| Mean | 7.5% | 6.7% |
| Median | 5.8% | 4.7% |
| Interquartile 25% (IQ1) | 3.8% | 3.0% |
| Interquartile 75% (IQ3) | 8.9% | 6.5% |
| Interquartile Range (IQR) | 5.1% | 3.5% |
| Standard Deviation (Sample) | 6.2% | 7.2% |
| Standard Deviation (Population) | 6.1% | 7.2% |
Similar Demographics by Male Unemployment
Demographics Similar to Menominee by Male Unemployment
In terms of male unemployment, the demographic groups most similar to Menominee are Tlingit-Haida (6.0%, a difference of 0.10%), Immigrants from Sierra Leone (6.0%, a difference of 0.15%), Armenian (6.0%, a difference of 0.33%), Immigrants from Uzbekistan (6.0%, a difference of 0.34%), and Immigrants from Liberia (6.1%, a difference of 0.52%).
| Demographics | Rating | Rank | Male Unemployment |
| Bermudans | 0.0 /100 | #268 | Tragic 5.9% |
| Immigrants | Nigeria | 0.0 /100 | #269 | Tragic 6.0% |
| Sub-Saharan Africans | 0.0 /100 | #270 | Tragic 6.0% |
| Blackfeet | 0.0 /100 | #271 | Tragic 6.0% |
| Immigrants | Uzbekistan | 0.0 /100 | #272 | Tragic 6.0% |
| Armenians | 0.0 /100 | #273 | Tragic 6.0% |
| Immigrants | Sierra Leone | 0.0 /100 | #274 | Tragic 6.0% |
| Menominee | 0.0 /100 | #275 | Tragic 6.0% |
| Tlingit-Haida | 0.0 /100 | #276 | Tragic 6.0% |
| Immigrants | Liberia | 0.0 /100 | #277 | Tragic 6.1% |
| Immigrants | Fiji | 0.0 /100 | #278 | Tragic 6.1% |
| Ghanaians | 0.0 /100 | #279 | Tragic 6.1% |
| Immigrants | Ghana | 0.0 /100 | #280 | Tragic 6.2% |
| Sierra Leoneans | 0.0 /100 | #281 | Tragic 6.2% |
| Ecuadorians | 0.0 /100 | #282 | Tragic 6.2% |
Demographics Similar to Latvians by Male Unemployment
In terms of male unemployment, the demographic groups most similar to Latvians are Welsh (4.8%, a difference of 0.080%), Immigrants from Nepal (4.8%, a difference of 0.30%), Sudanese (4.8%, a difference of 0.31%), British (4.8%, a difference of 0.56%), and Scottish (4.8%, a difference of 0.88%).
| Demographics | Rating | Rank | Male Unemployment |
| Dutch | 99.9 /100 | #26 | Exceptional 4.8% |
| Belgians | 99.9 /100 | #27 | Exceptional 4.8% |
| Bulgarians | 99.8 /100 | #28 | Exceptional 4.8% |
| Scottish | 99.8 /100 | #29 | Exceptional 4.8% |
| British | 99.8 /100 | #30 | Exceptional 4.8% |
| Sudanese | 99.8 /100 | #31 | Exceptional 4.8% |
| Immigrants | Nepal | 99.8 /100 | #32 | Exceptional 4.8% |
| Latvians | 99.7 /100 | #33 | Exceptional 4.8% |
| Welsh | 99.7 /100 | #34 | Exceptional 4.8% |
| Paraguayans | 99.5 /100 | #35 | Exceptional 4.9% |
| Immigrants | Singapore | 99.4 /100 | #36 | Exceptional 4.9% |
| Scotch-Irish | 99.4 /100 | #37 | Exceptional 4.9% |
| Immigrants | Bosnia and Herzegovina | 99.4 /100 | #38 | Exceptional 4.9% |
| Burmese | 99.3 /100 | #39 | Exceptional 4.9% |
| Northern Europeans | 99.3 /100 | #40 | Exceptional 4.9% |