Menominee vs Immigrants from Western Europe Per Capita Income
COMPARE
Menominee
Immigrants from Western Europe
Per Capita Income
Per Capita Income Comparison
Menominee
Immigrants from Western Europe
$34,578
PER CAPITA INCOME
0.0/ 100
METRIC RATING
328th/ 347
METRIC RANK
$50,065
PER CAPITA INCOME
99.9/ 100
METRIC RATING
55th/ 347
METRIC RANK
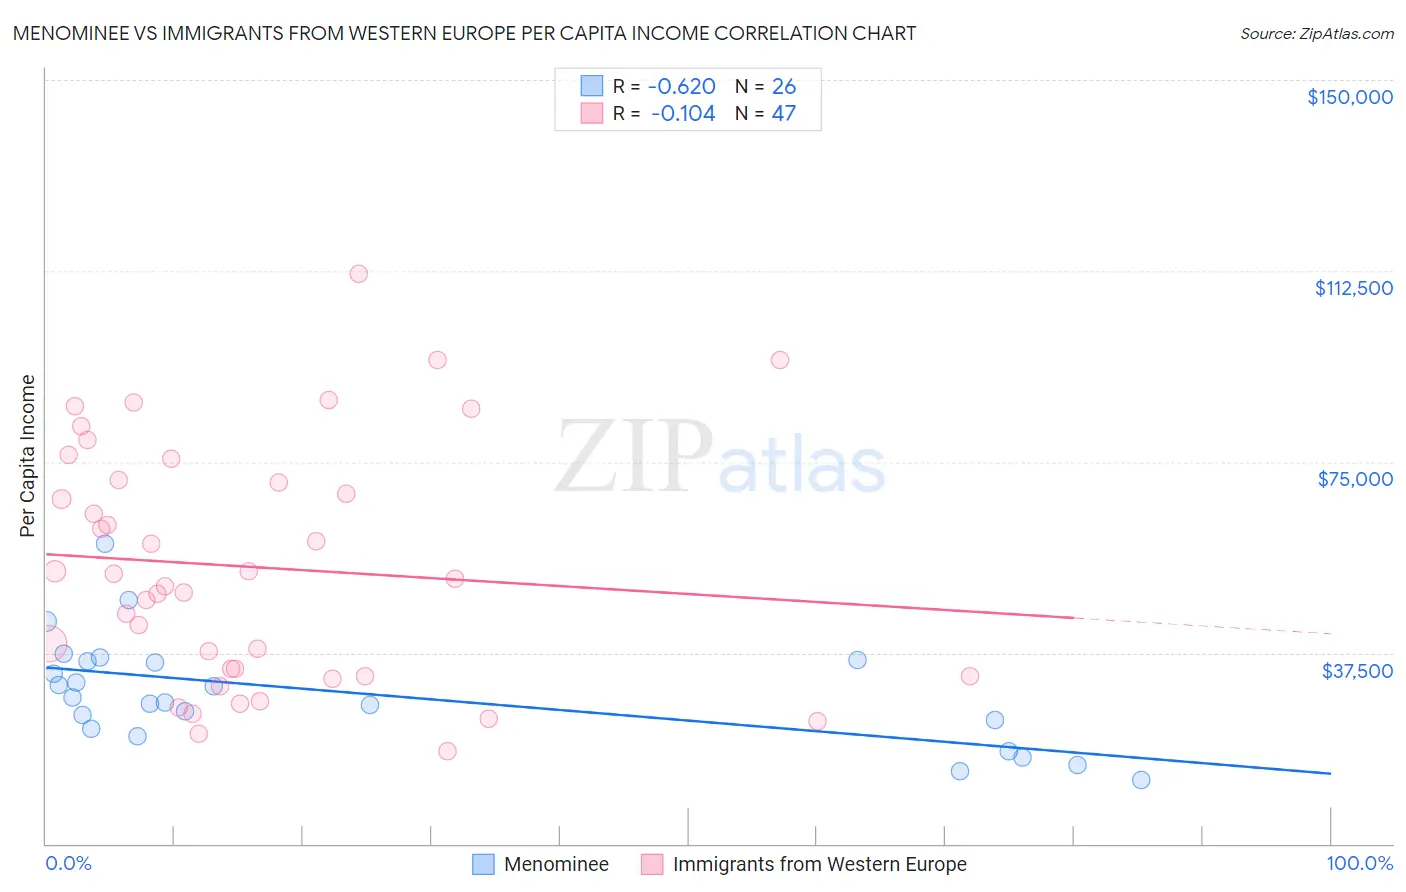
Menominee vs Immigrants from Western Europe Per Capita Income Correlation Chart
The statistical analysis conducted on geographies consisting of 45,778,979 people shows a significant negative correlation between the proportion of Menominee and per capita income in the United States with a correlation coefficient (R) of -0.620 and weighted average of $34,578. Similarly, the statistical analysis conducted on geographies consisting of 494,094,837 people shows a poor negative correlation between the proportion of Immigrants from Western Europe and per capita income in the United States with a correlation coefficient (R) of -0.104 and weighted average of $50,065, a difference of 44.8%.
Per Capita Income Correlation Summary
| Measurement | Menominee | Immigrants from Western Europe |
| Minimum | $12,454 | $18,269 |
| Maximum | $58,872 | $111,976 |
| Range | $46,418 | $93,707 |
| Mean | $29,500 | $54,316 |
| Median | $28,225 | $51,952 |
| Interquartile 25% (IQ1) | $22,568 | $33,002 |
| Interquartile 75% (IQ3) | $35,908 | $71,320 |
| Interquartile Range (IQR) | $13,340 | $38,319 |
| Standard Deviation (Sample) | $10,696 | $23,455 |
| Standard Deviation (Population) | $10,488 | $23,204 |
Similar Demographics by Per Capita Income
Demographics Similar to Menominee by Per Capita Income
In terms of per capita income, the demographic groups most similar to Menominee are Mexican ($34,559, a difference of 0.060%), Apache ($34,886, a difference of 0.89%), Immigrants from Cuba ($34,910, a difference of 0.96%), Spanish American Indian ($34,195, a difference of 1.1%), and Immigrants from Central America ($34,974, a difference of 1.1%).
| Demographics | Rating | Rank | Per Capita Income |
| Blacks/African Americans | 0.0 /100 | #321 | Tragic $35,564 |
| Creek | 0.0 /100 | #322 | Tragic $35,546 |
| Cheyenne | 0.0 /100 | #323 | Tragic $35,276 |
| Kiowa | 0.0 /100 | #324 | Tragic $35,102 |
| Immigrants | Central America | 0.0 /100 | #325 | Tragic $34,974 |
| Immigrants | Cuba | 0.0 /100 | #326 | Tragic $34,910 |
| Apache | 0.0 /100 | #327 | Tragic $34,886 |
| Menominee | 0.0 /100 | #328 | Tragic $34,578 |
| Mexicans | 0.0 /100 | #329 | Tragic $34,559 |
| Spanish American Indians | 0.0 /100 | #330 | Tragic $34,195 |
| Immigrants | Mexico | 0.0 /100 | #331 | Tragic $33,931 |
| Sioux | 0.0 /100 | #332 | Tragic $33,921 |
| Immigrants | Yemen | 0.0 /100 | #333 | Tragic $33,696 |
| Natives/Alaskans | 0.0 /100 | #334 | Tragic $33,279 |
| Yuman | 0.0 /100 | #335 | Tragic $33,236 |
Demographics Similar to Immigrants from Western Europe by Per Capita Income
In terms of per capita income, the demographic groups most similar to Immigrants from Western Europe are Asian ($50,057, a difference of 0.020%), South African ($50,044, a difference of 0.040%), Immigrants from Malaysia ($49,983, a difference of 0.16%), Bhutanese ($49,894, a difference of 0.34%), and Immigrants from Scotland ($49,893, a difference of 0.34%).
| Demographics | Rating | Rank | Per Capita Income |
| Immigrants | Serbia | 100.0 /100 | #48 | Exceptional $50,810 |
| New Zealanders | 100.0 /100 | #49 | Exceptional $50,575 |
| Immigrants | Sri Lanka | 100.0 /100 | #50 | Exceptional $50,555 |
| Immigrants | Netherlands | 100.0 /100 | #51 | Exceptional $50,458 |
| Immigrants | Croatia | 99.9 /100 | #52 | Exceptional $50,417 |
| Paraguayans | 99.9 /100 | #53 | Exceptional $50,385 |
| Immigrants | Belarus | 99.9 /100 | #54 | Exceptional $50,303 |
| Immigrants | Western Europe | 99.9 /100 | #55 | Exceptional $50,065 |
| Asians | 99.9 /100 | #56 | Exceptional $50,057 |
| South Africans | 99.9 /100 | #57 | Exceptional $50,044 |
| Immigrants | Malaysia | 99.9 /100 | #58 | Exceptional $49,983 |
| Bhutanese | 99.9 /100 | #59 | Exceptional $49,894 |
| Immigrants | Scotland | 99.9 /100 | #60 | Exceptional $49,893 |
| Argentineans | 99.9 /100 | #61 | Exceptional $49,862 |
| Immigrants | Asia | 99.9 /100 | #62 | Exceptional $49,741 |