Hmong vs Immigrants from Western Europe Per Capita Income
COMPARE
Hmong
Immigrants from Western Europe
Per Capita Income
Per Capita Income Comparison
Hmong
Immigrants from Western Europe
$38,120
PER CAPITA INCOME
0.2/ 100
METRIC RATING
276th/ 347
METRIC RANK
$50,065
PER CAPITA INCOME
99.9/ 100
METRIC RATING
55th/ 347
METRIC RANK
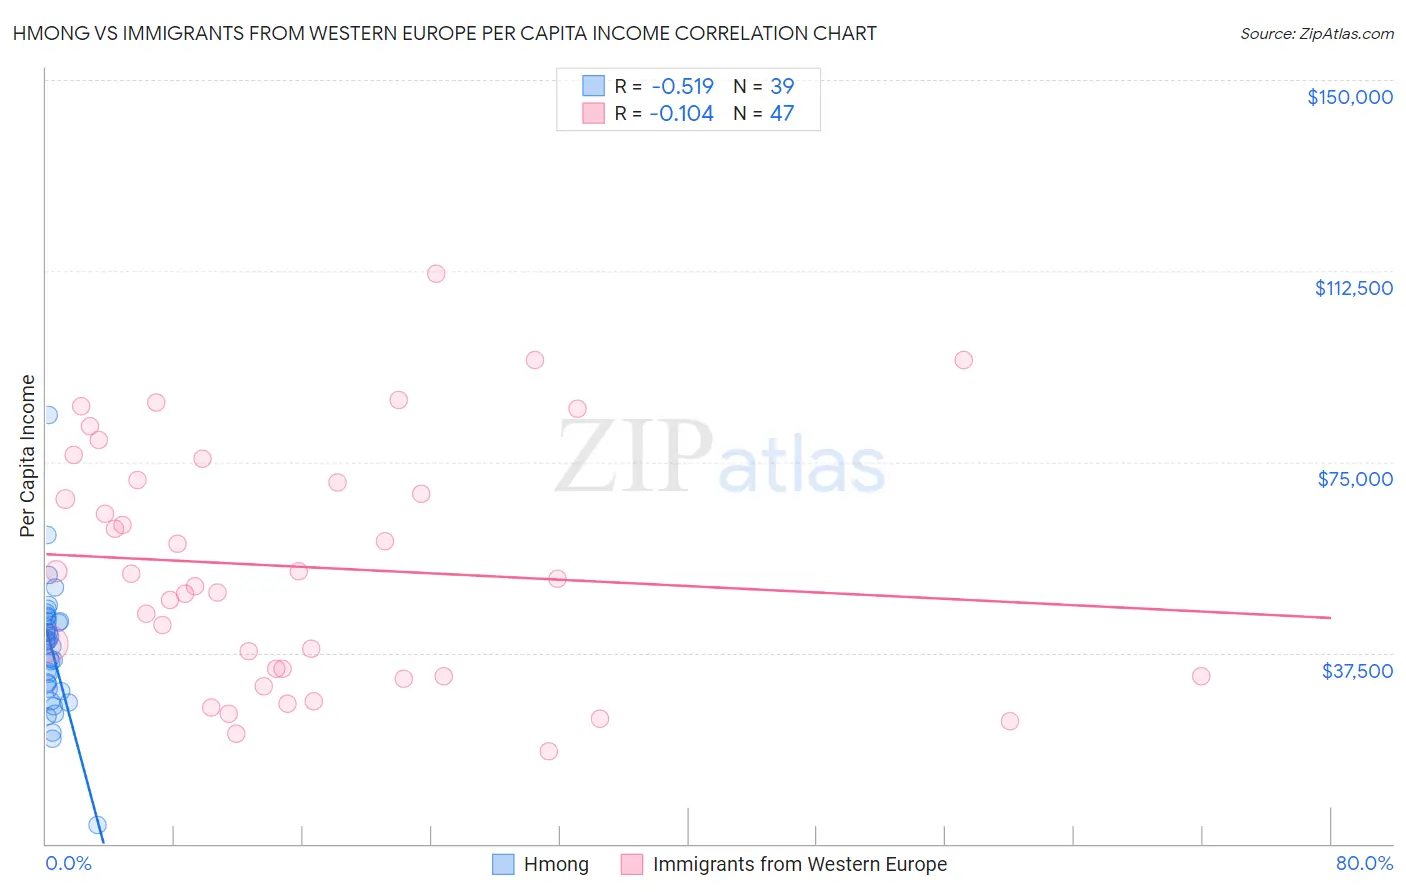
Hmong vs Immigrants from Western Europe Per Capita Income Correlation Chart
The statistical analysis conducted on geographies consisting of 24,672,334 people shows a substantial negative correlation between the proportion of Hmong and per capita income in the United States with a correlation coefficient (R) of -0.519 and weighted average of $38,120. Similarly, the statistical analysis conducted on geographies consisting of 494,094,837 people shows a poor negative correlation between the proportion of Immigrants from Western Europe and per capita income in the United States with a correlation coefficient (R) of -0.104 and weighted average of $50,065, a difference of 31.3%.
Per Capita Income Correlation Summary
| Measurement | Hmong | Immigrants from Western Europe |
| Minimum | $3,563 | $18,269 |
| Maximum | $84,315 | $111,976 |
| Range | $80,752 | $93,707 |
| Mean | $38,244 | $54,316 |
| Median | $39,777 | $51,952 |
| Interquartile 25% (IQ1) | $30,464 | $33,002 |
| Interquartile 75% (IQ3) | $43,732 | $71,320 |
| Interquartile Range (IQR) | $13,268 | $38,319 |
| Standard Deviation (Sample) | $12,703 | $23,455 |
| Standard Deviation (Population) | $12,539 | $23,204 |
Similar Demographics by Per Capita Income
Demographics Similar to Hmong by Per Capita Income
In terms of per capita income, the demographic groups most similar to Hmong are Comanche ($38,088, a difference of 0.080%), Immigrants from Liberia ($38,165, a difference of 0.12%), Immigrants from Nicaragua ($38,065, a difference of 0.15%), Colville ($38,047, a difference of 0.19%), and Potawatomi ($38,046, a difference of 0.20%).
| Demographics | Rating | Rank | Per Capita Income |
| Immigrants | Jamaica | 0.4 /100 | #269 | Tragic $38,766 |
| Immigrants | Belize | 0.3 /100 | #270 | Tragic $38,614 |
| Central Americans | 0.3 /100 | #271 | Tragic $38,560 |
| Immigrants | Cabo Verde | 0.3 /100 | #272 | Tragic $38,540 |
| Nepalese | 0.3 /100 | #273 | Tragic $38,442 |
| Immigrants | El Salvador | 0.3 /100 | #274 | Tragic $38,394 |
| Immigrants | Liberia | 0.2 /100 | #275 | Tragic $38,165 |
| Hmong | 0.2 /100 | #276 | Tragic $38,120 |
| Comanche | 0.2 /100 | #277 | Tragic $38,088 |
| Immigrants | Nicaragua | 0.2 /100 | #278 | Tragic $38,065 |
| Colville | 0.2 /100 | #279 | Tragic $38,047 |
| Potawatomi | 0.2 /100 | #280 | Tragic $38,046 |
| Immigrants | Dominica | 0.2 /100 | #281 | Tragic $37,952 |
| Immigrants | Laos | 0.1 /100 | #282 | Tragic $37,857 |
| Pennsylvania Germans | 0.1 /100 | #283 | Tragic $37,842 |
Demographics Similar to Immigrants from Western Europe by Per Capita Income
In terms of per capita income, the demographic groups most similar to Immigrants from Western Europe are Asian ($50,057, a difference of 0.020%), South African ($50,044, a difference of 0.040%), Immigrants from Malaysia ($49,983, a difference of 0.16%), Bhutanese ($49,894, a difference of 0.34%), and Immigrants from Scotland ($49,893, a difference of 0.34%).
| Demographics | Rating | Rank | Per Capita Income |
| Immigrants | Serbia | 100.0 /100 | #48 | Exceptional $50,810 |
| New Zealanders | 100.0 /100 | #49 | Exceptional $50,575 |
| Immigrants | Sri Lanka | 100.0 /100 | #50 | Exceptional $50,555 |
| Immigrants | Netherlands | 100.0 /100 | #51 | Exceptional $50,458 |
| Immigrants | Croatia | 99.9 /100 | #52 | Exceptional $50,417 |
| Paraguayans | 99.9 /100 | #53 | Exceptional $50,385 |
| Immigrants | Belarus | 99.9 /100 | #54 | Exceptional $50,303 |
| Immigrants | Western Europe | 99.9 /100 | #55 | Exceptional $50,065 |
| Asians | 99.9 /100 | #56 | Exceptional $50,057 |
| South Africans | 99.9 /100 | #57 | Exceptional $50,044 |
| Immigrants | Malaysia | 99.9 /100 | #58 | Exceptional $49,983 |
| Bhutanese | 99.9 /100 | #59 | Exceptional $49,894 |
| Immigrants | Scotland | 99.9 /100 | #60 | Exceptional $49,893 |
| Argentineans | 99.9 /100 | #61 | Exceptional $49,862 |
| Immigrants | Asia | 99.9 /100 | #62 | Exceptional $49,741 |