Macedonian vs Liberian Median Household Income
COMPARE
Macedonian
Liberian
Median Household Income
Median Household Income Comparison
Macedonians
Liberians
$90,761
MEDIAN HOUSEHOLD INCOME
97.4/ 100
METRIC RATING
106th/ 347
METRIC RANK
$75,667
MEDIAN HOUSEHOLD INCOME
0.2/ 100
METRIC RATING
273rd/ 347
METRIC RANK
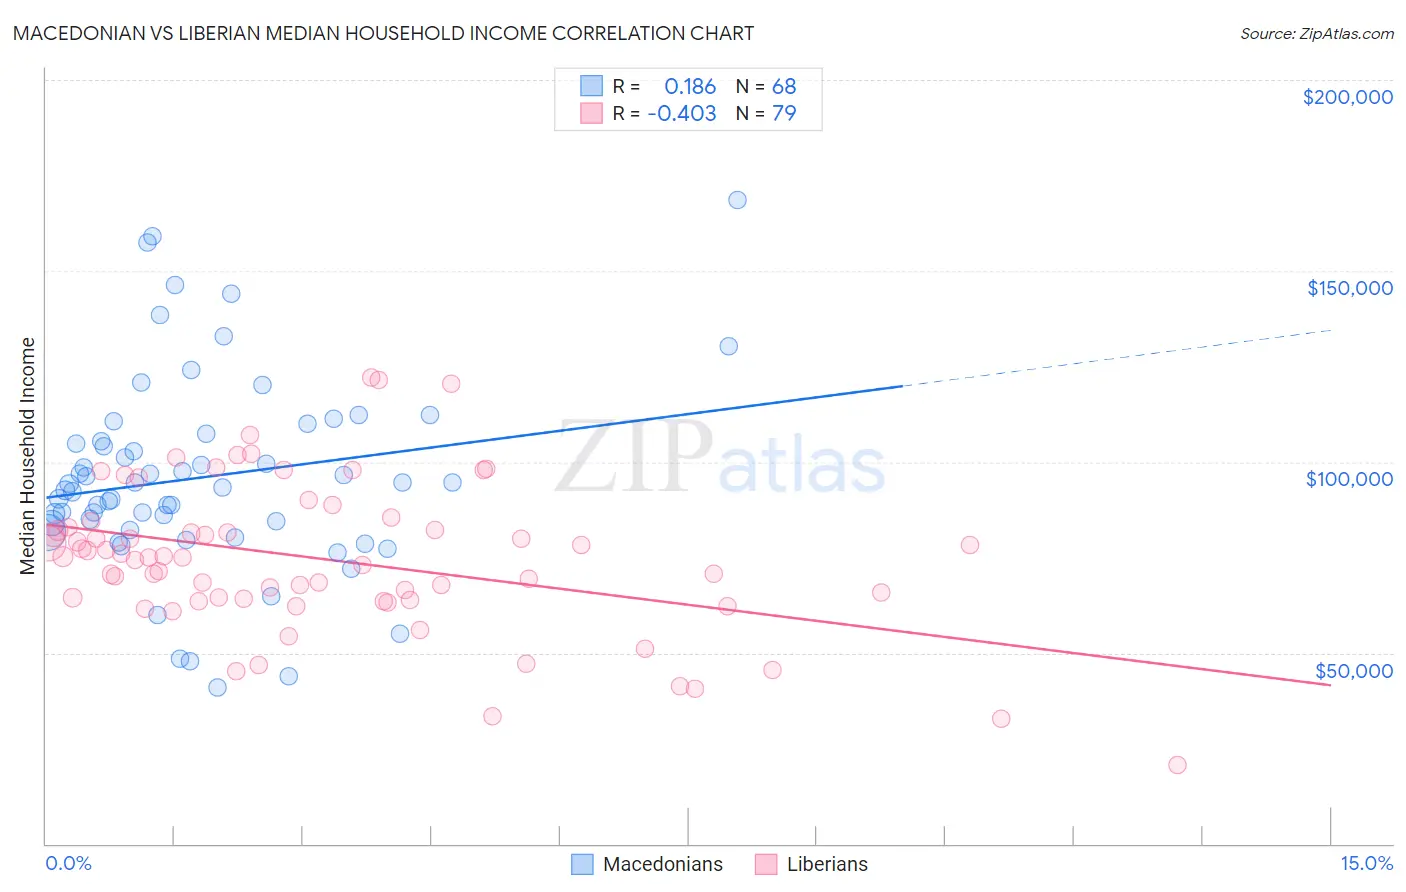
Macedonian vs Liberian Median Household Income Correlation Chart
The statistical analysis conducted on geographies consisting of 132,580,342 people shows a poor positive correlation between the proportion of Macedonians and median household income in the United States with a correlation coefficient (R) of 0.186 and weighted average of $90,761. Similarly, the statistical analysis conducted on geographies consisting of 118,026,657 people shows a moderate negative correlation between the proportion of Liberians and median household income in the United States with a correlation coefficient (R) of -0.403 and weighted average of $75,667, a difference of 20.0%.
Median Household Income Correlation Summary
| Measurement | Macedonian | Liberian |
| Minimum | $40,833 | $20,699 |
| Maximum | $168,448 | $122,146 |
| Range | $127,615 | $101,447 |
| Mean | $96,021 | $74,517 |
| Median | $93,863 | $74,984 |
| Interquartile 25% (IQ1) | $83,085 | $63,718 |
| Interquartile 75% (IQ3) | $106,377 | $82,932 |
| Interquartile Range (IQR) | $23,292 | $19,214 |
| Standard Deviation (Sample) | $25,740 | $19,716 |
| Standard Deviation (Population) | $25,550 | $19,591 |
Similar Demographics by Median Household Income
Demographics Similar to Macedonians by Median Household Income
In terms of median household income, the demographic groups most similar to Macedonians are Croatian ($90,685, a difference of 0.080%), Immigrants from Brazil ($90,907, a difference of 0.16%), Zimbabwean ($90,618, a difference of 0.16%), Chilean ($90,605, a difference of 0.17%), and Palestinian ($90,574, a difference of 0.21%).
| Demographics | Rating | Rank | Median Household Income |
| Immigrants | South Eastern Asia | 98.4 /100 | #99 | Exceptional $91,541 |
| Ukrainians | 98.3 /100 | #100 | Exceptional $91,456 |
| Immigrants | Moldova | 98.3 /100 | #101 | Exceptional $91,446 |
| Austrians | 98.2 /100 | #102 | Exceptional $91,339 |
| Immigrants | Ukraine | 98.0 /100 | #103 | Exceptional $91,124 |
| Immigrants | Kazakhstan | 97.8 /100 | #104 | Exceptional $91,015 |
| Immigrants | Brazil | 97.7 /100 | #105 | Exceptional $90,907 |
| Macedonians | 97.4 /100 | #106 | Exceptional $90,761 |
| Croatians | 97.3 /100 | #107 | Exceptional $90,685 |
| Zimbabweans | 97.2 /100 | #108 | Exceptional $90,618 |
| Chileans | 97.2 /100 | #109 | Exceptional $90,605 |
| Palestinians | 97.1 /100 | #110 | Exceptional $90,574 |
| Immigrants | Poland | 97.1 /100 | #111 | Exceptional $90,549 |
| Northern Europeans | 96.9 /100 | #112 | Exceptional $90,446 |
| Peruvians | 96.5 /100 | #113 | Exceptional $90,261 |
Demographics Similar to Liberians by Median Household Income
In terms of median household income, the demographic groups most similar to Liberians are British West Indian ($75,647, a difference of 0.030%), Immigrants from Micronesia ($75,574, a difference of 0.12%), Somali ($75,782, a difference of 0.15%), Pennsylvania German ($75,814, a difference of 0.19%), and Hmong ($75,839, a difference of 0.23%).
| Demographics | Rating | Rank | Median Household Income |
| Americans | 0.3 /100 | #266 | Tragic $75,932 |
| German Russians | 0.3 /100 | #267 | Tragic $75,856 |
| Immigrants | Jamaica | 0.3 /100 | #268 | Tragic $75,851 |
| Cape Verdeans | 0.3 /100 | #269 | Tragic $75,848 |
| Hmong | 0.3 /100 | #270 | Tragic $75,839 |
| Pennsylvania Germans | 0.3 /100 | #271 | Tragic $75,814 |
| Somalis | 0.3 /100 | #272 | Tragic $75,782 |
| Liberians | 0.2 /100 | #273 | Tragic $75,667 |
| British West Indians | 0.2 /100 | #274 | Tragic $75,647 |
| Immigrants | Micronesia | 0.2 /100 | #275 | Tragic $75,574 |
| Immigrants | Latin America | 0.2 /100 | #276 | Tragic $75,420 |
| Spanish Americans | 0.2 /100 | #277 | Tragic $75,386 |
| Osage | 0.2 /100 | #278 | Tragic $75,240 |
| Immigrants | Guatemala | 0.2 /100 | #279 | Tragic $75,123 |
| Senegalese | 0.2 /100 | #280 | Tragic $74,999 |