Macedonian vs Costa Rican Median Household Income
COMPARE
Macedonian
Costa Rican
Median Household Income
Median Household Income Comparison
Macedonians
Costa Ricans
$90,761
MEDIAN HOUSEHOLD INCOME
97.4/ 100
METRIC RATING
106th/ 347
METRIC RANK
$87,262
MEDIAN HOUSEHOLD INCOME
80.0/ 100
METRIC RATING
148th/ 347
METRIC RANK
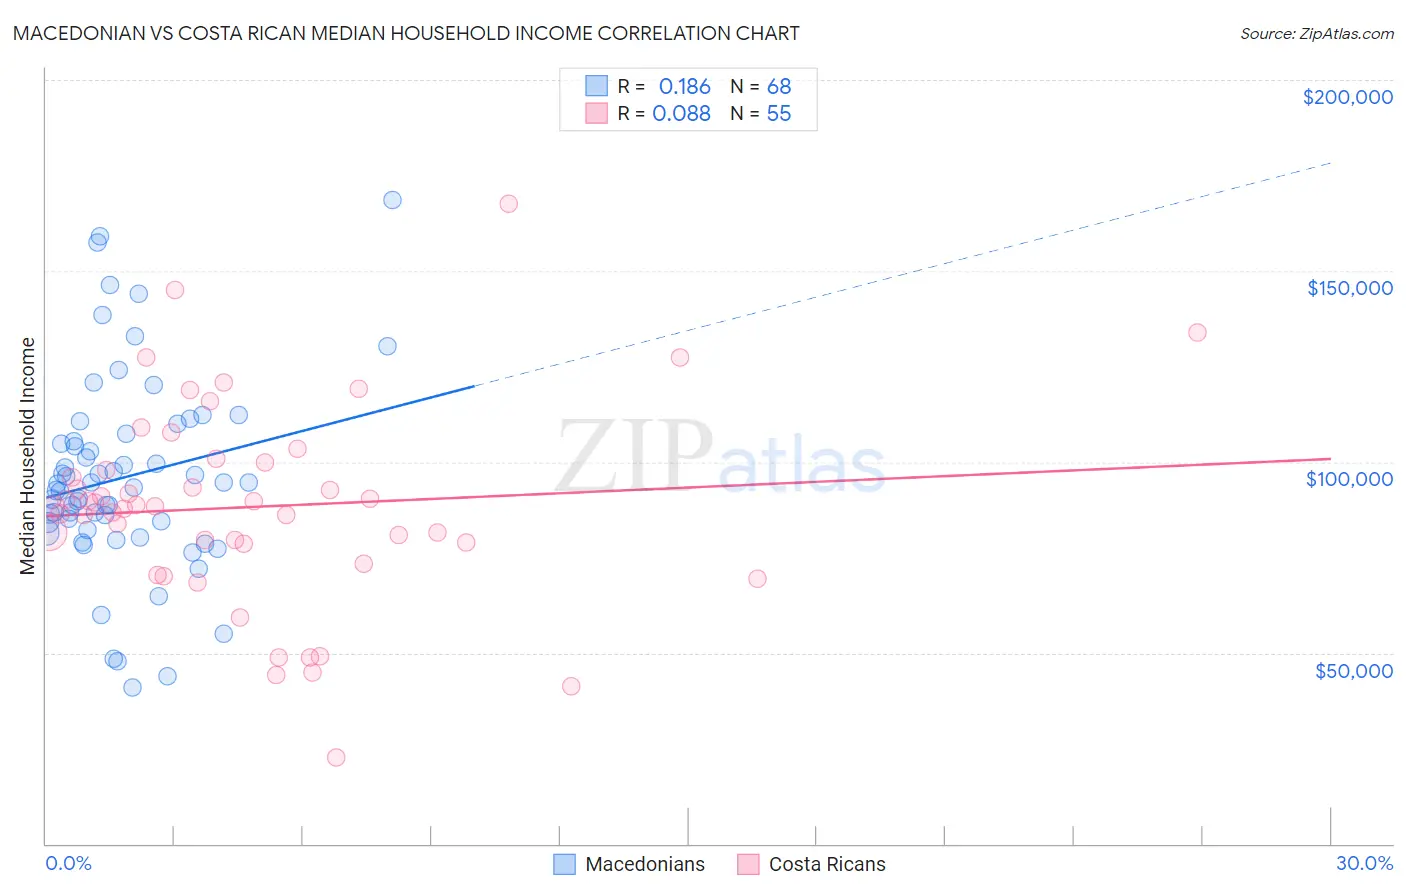
Macedonian vs Costa Rican Median Household Income Correlation Chart
The statistical analysis conducted on geographies consisting of 132,580,342 people shows a poor positive correlation between the proportion of Macedonians and median household income in the United States with a correlation coefficient (R) of 0.186 and weighted average of $90,761. Similarly, the statistical analysis conducted on geographies consisting of 253,413,856 people shows a slight positive correlation between the proportion of Costa Ricans and median household income in the United States with a correlation coefficient (R) of 0.088 and weighted average of $87,262, a difference of 4.0%.
Median Household Income Correlation Summary
| Measurement | Macedonian | Costa Rican |
| Minimum | $40,833 | $22,708 |
| Maximum | $168,448 | $167,647 |
| Range | $127,615 | $144,939 |
| Mean | $96,021 | $88,260 |
| Median | $93,863 | $88,335 |
| Interquartile 25% (IQ1) | $83,085 | $78,591 |
| Interquartile 75% (IQ3) | $106,377 | $99,928 |
| Interquartile Range (IQR) | $23,292 | $21,337 |
| Standard Deviation (Sample) | $25,740 | $26,495 |
| Standard Deviation (Population) | $25,550 | $26,253 |
Similar Demographics by Median Household Income
Demographics Similar to Macedonians by Median Household Income
In terms of median household income, the demographic groups most similar to Macedonians are Croatian ($90,685, a difference of 0.080%), Immigrants from Brazil ($90,907, a difference of 0.16%), Zimbabwean ($90,618, a difference of 0.16%), Chilean ($90,605, a difference of 0.17%), and Palestinian ($90,574, a difference of 0.21%).
| Demographics | Rating | Rank | Median Household Income |
| Immigrants | South Eastern Asia | 98.4 /100 | #99 | Exceptional $91,541 |
| Ukrainians | 98.3 /100 | #100 | Exceptional $91,456 |
| Immigrants | Moldova | 98.3 /100 | #101 | Exceptional $91,446 |
| Austrians | 98.2 /100 | #102 | Exceptional $91,339 |
| Immigrants | Ukraine | 98.0 /100 | #103 | Exceptional $91,124 |
| Immigrants | Kazakhstan | 97.8 /100 | #104 | Exceptional $91,015 |
| Immigrants | Brazil | 97.7 /100 | #105 | Exceptional $90,907 |
| Macedonians | 97.4 /100 | #106 | Exceptional $90,761 |
| Croatians | 97.3 /100 | #107 | Exceptional $90,685 |
| Zimbabweans | 97.2 /100 | #108 | Exceptional $90,618 |
| Chileans | 97.2 /100 | #109 | Exceptional $90,605 |
| Palestinians | 97.1 /100 | #110 | Exceptional $90,574 |
| Immigrants | Poland | 97.1 /100 | #111 | Exceptional $90,549 |
| Northern Europeans | 96.9 /100 | #112 | Exceptional $90,446 |
| Peruvians | 96.5 /100 | #113 | Exceptional $90,261 |
Demographics Similar to Costa Ricans by Median Household Income
In terms of median household income, the demographic groups most similar to Costa Ricans are South American Indian ($87,446, a difference of 0.21%), Immigrants from Nepal ($87,046, a difference of 0.25%), Basque ($87,001, a difference of 0.30%), Immigrants from Uganda ($87,553, a difference of 0.33%), and Ugandan ($87,557, a difference of 0.34%).
| Demographics | Rating | Rank | Median Household Income |
| Immigrants | Morocco | 86.0 /100 | #141 | Excellent $87,930 |
| Canadians | 84.7 /100 | #142 | Excellent $87,769 |
| Danes | 83.9 /100 | #143 | Excellent $87,676 |
| Serbians | 83.0 /100 | #144 | Excellent $87,572 |
| Ugandans | 82.9 /100 | #145 | Excellent $87,557 |
| Immigrants | Uganda | 82.8 /100 | #146 | Excellent $87,553 |
| South American Indians | 81.8 /100 | #147 | Excellent $87,446 |
| Costa Ricans | 80.0 /100 | #148 | Excellent $87,262 |
| Immigrants | Nepal | 77.7 /100 | #149 | Good $87,046 |
| Basques | 77.2 /100 | #150 | Good $87,001 |
| Hungarians | 76.3 /100 | #151 | Good $86,920 |
| Immigrants | Saudi Arabia | 75.8 /100 | #152 | Good $86,875 |
| South Americans | 75.1 /100 | #153 | Good $86,824 |
| Immigrants | Germany | 74.4 /100 | #154 | Good $86,764 |
| Carpatho Rusyns | 72.8 /100 | #155 | Good $86,635 |