Lithuanian vs Immigrants from South Central Asia Wage/Income Gap
COMPARE
Lithuanian
Immigrants from South Central Asia
Wage/Income Gap
Wage/Income Gap Comparison
Lithuanians
Immigrants from South Central Asia
28.7%
WAGE/INCOME GAP
0.1/ 100
METRIC RATING
316th/ 347
METRIC RANK
29.3%
WAGE/INCOME GAP
0.0/ 100
METRIC RATING
332nd/ 347
METRIC RANK
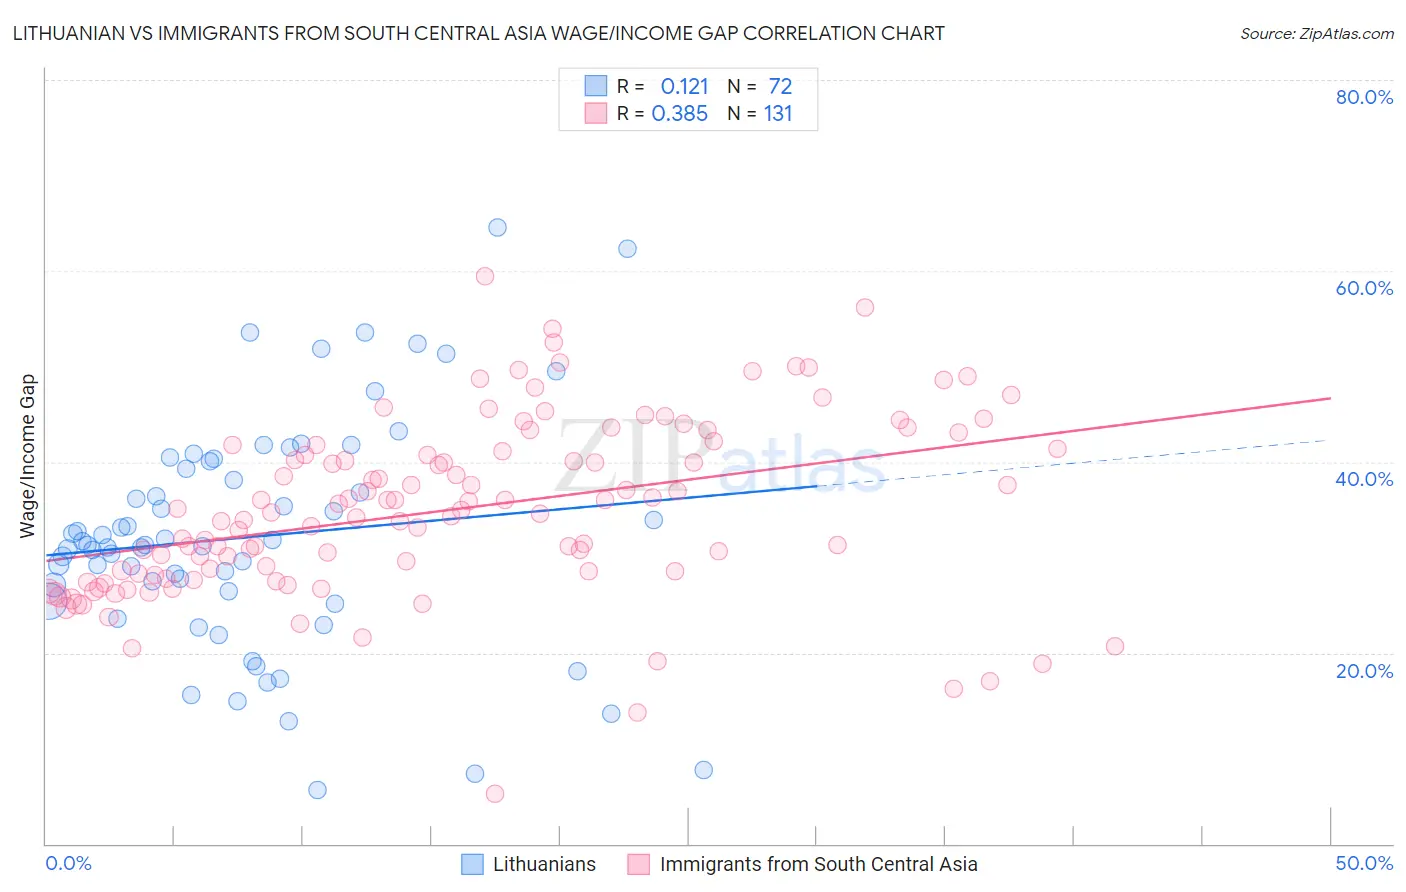
Lithuanian vs Immigrants from South Central Asia Wage/Income Gap Correlation Chart
The statistical analysis conducted on geographies consisting of 421,511,979 people shows a poor positive correlation between the proportion of Lithuanians and wage/income gap percentage in the United States with a correlation coefficient (R) of 0.121 and weighted average of 28.7%. Similarly, the statistical analysis conducted on geographies consisting of 472,660,484 people shows a mild positive correlation between the proportion of Immigrants from South Central Asia and wage/income gap percentage in the United States with a correlation coefficient (R) of 0.385 and weighted average of 29.3%, a difference of 2.0%.
Wage/Income Gap Correlation Summary
| Measurement | Lithuanian | Immigrants from South Central Asia |
| Minimum | 5.6% | 5.2% |
| Maximum | 64.5% | 59.4% |
| Range | 58.9% | 54.2% |
| Mean | 32.1% | 34.9% |
| Median | 31.3% | 34.6% |
| Interquartile 25% (IQ1) | 25.9% | 28.1% |
| Interquartile 75% (IQ3) | 39.7% | 41.3% |
| Interquartile Range (IQR) | 13.8% | 13.2% |
| Standard Deviation (Sample) | 12.1% | 9.3% |
| Standard Deviation (Population) | 12.0% | 9.2% |
Demographics Similar to Lithuanians and Immigrants from South Central Asia by Wage/Income Gap
In terms of wage/income gap, the demographic groups most similar to Lithuanians are Maltese (28.7%, a difference of 0.010%), Immigrants from Scotland (28.7%, a difference of 0.060%), Belgian (28.8%, a difference of 0.11%), Basque (28.8%, a difference of 0.16%), and Slovak (28.9%, a difference of 0.47%). Similarly, the demographic groups most similar to Immigrants from South Central Asia are European (29.4%, a difference of 0.19%), Swedish (29.4%, a difference of 0.34%), Czech (29.2%, a difference of 0.51%), German (29.2%, a difference of 0.55%), and Scottish (29.1%, a difference of 0.66%).
| Demographics | Rating | Rank | Wage/Income Gap |
| Immigrants | Scotland | 0.1 /100 | #314 | Tragic 28.7% |
| Maltese | 0.1 /100 | #315 | Tragic 28.7% |
| Lithuanians | 0.1 /100 | #316 | Tragic 28.7% |
| Belgians | 0.1 /100 | #317 | Tragic 28.8% |
| Basques | 0.1 /100 | #318 | Tragic 28.8% |
| Slovaks | 0.1 /100 | #319 | Tragic 28.9% |
| British | 0.1 /100 | #320 | Tragic 28.9% |
| Welsh | 0.1 /100 | #321 | Tragic 28.9% |
| Immigrants | Singapore | 0.1 /100 | #322 | Tragic 28.9% |
| Norwegians | 0.1 /100 | #323 | Tragic 29.0% |
| Croatians | 0.0 /100 | #324 | Tragic 29.0% |
| Hungarians | 0.0 /100 | #325 | Tragic 29.0% |
| Immigrants | Belgium | 0.0 /100 | #326 | Tragic 29.0% |
| Immigrants | Iran | 0.0 /100 | #327 | Tragic 29.1% |
| Scandinavians | 0.0 /100 | #328 | Tragic 29.1% |
| Scottish | 0.0 /100 | #329 | Tragic 29.1% |
| Germans | 0.0 /100 | #330 | Tragic 29.2% |
| Czechs | 0.0 /100 | #331 | Tragic 29.2% |
| Immigrants | South Central Asia | 0.0 /100 | #332 | Tragic 29.3% |
| Europeans | 0.0 /100 | #333 | Tragic 29.4% |
| Swedes | 0.0 /100 | #334 | Tragic 29.4% |