Lithuanian vs Immigrants from Asia Wage/Income Gap
COMPARE
Lithuanian
Immigrants from Asia
Wage/Income Gap
Wage/Income Gap Comparison
Lithuanians
Immigrants from Asia
28.7%
WAGE/INCOME GAP
0.1/ 100
METRIC RATING
316th/ 347
METRIC RANK
27.0%
WAGE/INCOME GAP
5.5/ 100
METRIC RATING
229th/ 347
METRIC RANK
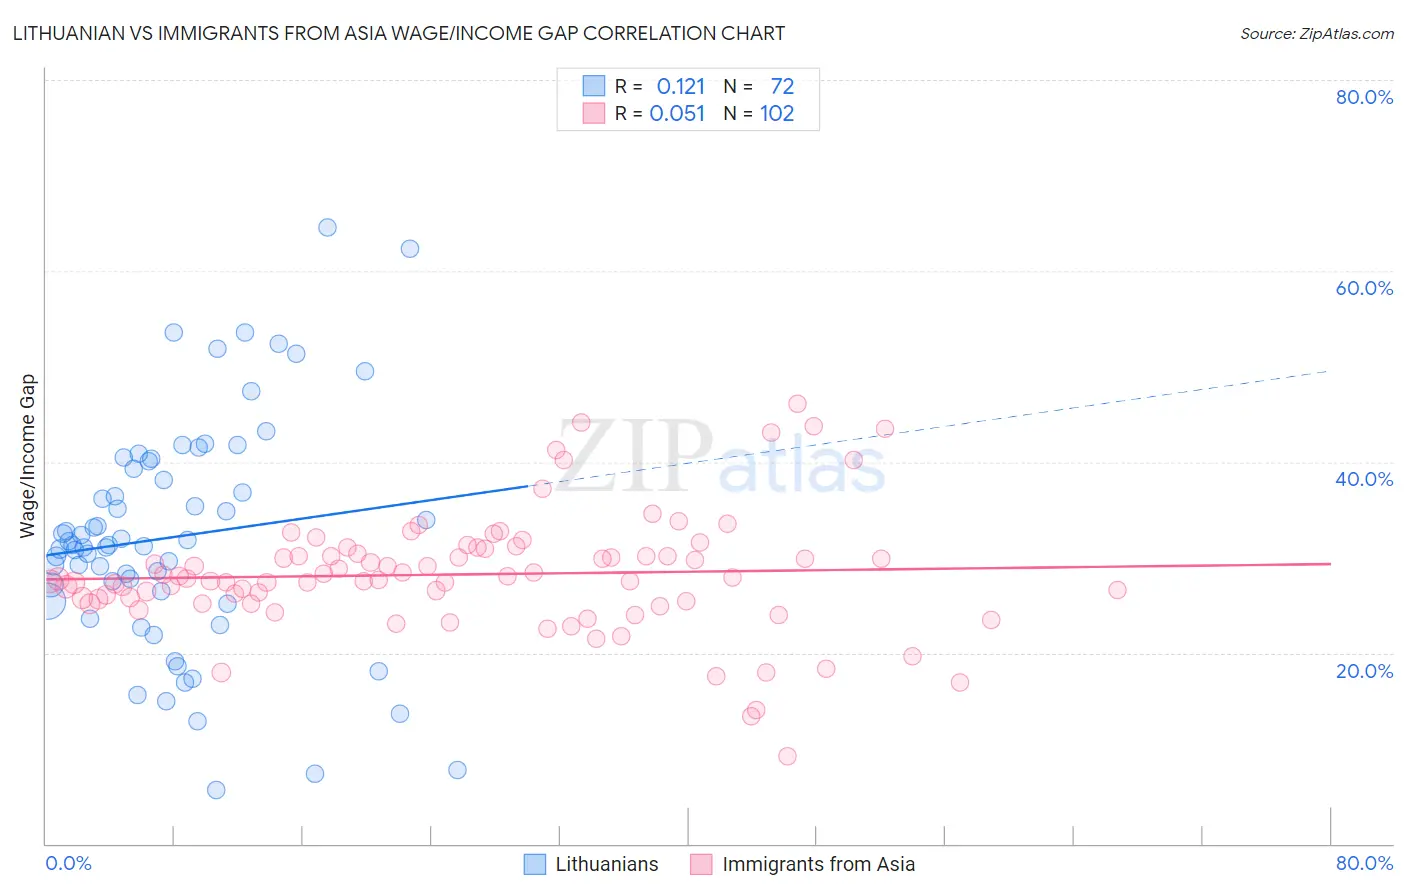
Lithuanian vs Immigrants from Asia Wage/Income Gap Correlation Chart
The statistical analysis conducted on geographies consisting of 421,511,979 people shows a poor positive correlation between the proportion of Lithuanians and wage/income gap percentage in the United States with a correlation coefficient (R) of 0.121 and weighted average of 28.7%. Similarly, the statistical analysis conducted on geographies consisting of 547,716,290 people shows a slight positive correlation between the proportion of Immigrants from Asia and wage/income gap percentage in the United States with a correlation coefficient (R) of 0.051 and weighted average of 27.0%, a difference of 6.6%.
Wage/Income Gap Correlation Summary
| Measurement | Lithuanian | Immigrants from Asia |
| Minimum | 5.6% | 9.2% |
| Maximum | 64.5% | 46.1% |
| Range | 58.9% | 36.9% |
| Mean | 32.1% | 28.2% |
| Median | 31.3% | 27.8% |
| Interquartile 25% (IQ1) | 25.9% | 25.4% |
| Interquartile 75% (IQ3) | 39.7% | 30.4% |
| Interquartile Range (IQR) | 13.8% | 4.9% |
| Standard Deviation (Sample) | 12.1% | 6.3% |
| Standard Deviation (Population) | 12.0% | 6.2% |
Similar Demographics by Wage/Income Gap
Demographics Similar to Lithuanians by Wage/Income Gap
In terms of wage/income gap, the demographic groups most similar to Lithuanians are Maltese (28.7%, a difference of 0.010%), Immigrants from Scotland (28.7%, a difference of 0.060%), Belgian (28.8%, a difference of 0.11%), Basque (28.8%, a difference of 0.16%), and French (28.7%, a difference of 0.20%).
| Demographics | Rating | Rank | Wage/Income Gap |
| Macedonians | 0.1 /100 | #309 | Tragic 28.6% |
| Finns | 0.1 /100 | #310 | Tragic 28.6% |
| Immigrants | Lithuania | 0.1 /100 | #311 | Tragic 28.6% |
| Eastern Europeans | 0.1 /100 | #312 | Tragic 28.6% |
| French | 0.1 /100 | #313 | Tragic 28.7% |
| Immigrants | Scotland | 0.1 /100 | #314 | Tragic 28.7% |
| Maltese | 0.1 /100 | #315 | Tragic 28.7% |
| Lithuanians | 0.1 /100 | #316 | Tragic 28.7% |
| Belgians | 0.1 /100 | #317 | Tragic 28.8% |
| Basques | 0.1 /100 | #318 | Tragic 28.8% |
| Slovaks | 0.1 /100 | #319 | Tragic 28.9% |
| British | 0.1 /100 | #320 | Tragic 28.9% |
| Welsh | 0.1 /100 | #321 | Tragic 28.9% |
| Immigrants | Singapore | 0.1 /100 | #322 | Tragic 28.9% |
| Norwegians | 0.1 /100 | #323 | Tragic 29.0% |
Demographics Similar to Immigrants from Asia by Wage/Income Gap
In terms of wage/income gap, the demographic groups most similar to Immigrants from Asia are Immigrants from Turkey (27.0%, a difference of 0.030%), Spaniard (27.0%, a difference of 0.040%), Ottawa (27.0%, a difference of 0.050%), Bhutanese (27.0%, a difference of 0.070%), and Argentinean (27.0%, a difference of 0.10%).
| Demographics | Rating | Rank | Wage/Income Gap |
| Bolivians | 8.3 /100 | #222 | Tragic 26.8% |
| Jordanians | 8.0 /100 | #223 | Tragic 26.8% |
| Immigrants | Argentina | 7.2 /100 | #224 | Tragic 26.8% |
| Immigrants | Ireland | 6.5 /100 | #225 | Tragic 26.9% |
| Asians | 5.9 /100 | #226 | Tragic 26.9% |
| Spaniards | 5.6 /100 | #227 | Tragic 27.0% |
| Immigrants | Turkey | 5.6 /100 | #228 | Tragic 27.0% |
| Immigrants | Asia | 5.5 /100 | #229 | Tragic 27.0% |
| Ottawa | 5.3 /100 | #230 | Tragic 27.0% |
| Bhutanese | 5.3 /100 | #231 | Tragic 27.0% |
| Argentineans | 5.2 /100 | #232 | Tragic 27.0% |
| Immigrants | Brazil | 5.0 /100 | #233 | Tragic 27.0% |
| Immigrants | Pakistan | 4.9 /100 | #234 | Tragic 27.0% |
| Immigrants | Hungary | 4.8 /100 | #235 | Tragic 27.0% |
| Immigrants | Romania | 4.8 /100 | #236 | Tragic 27.0% |