Laotian vs Immigrants from Congo Median Household Income
COMPARE
Laotian
Immigrants from Congo
Median Household Income
Median Household Income Comparison
Laotians
Immigrants from Congo
$94,990
MEDIAN HOUSEHOLD INCOME
99.8/ 100
METRIC RATING
61st/ 347
METRIC RANK
$66,768
MEDIAN HOUSEHOLD INCOME
0.0/ 100
METRIC RATING
336th/ 347
METRIC RANK
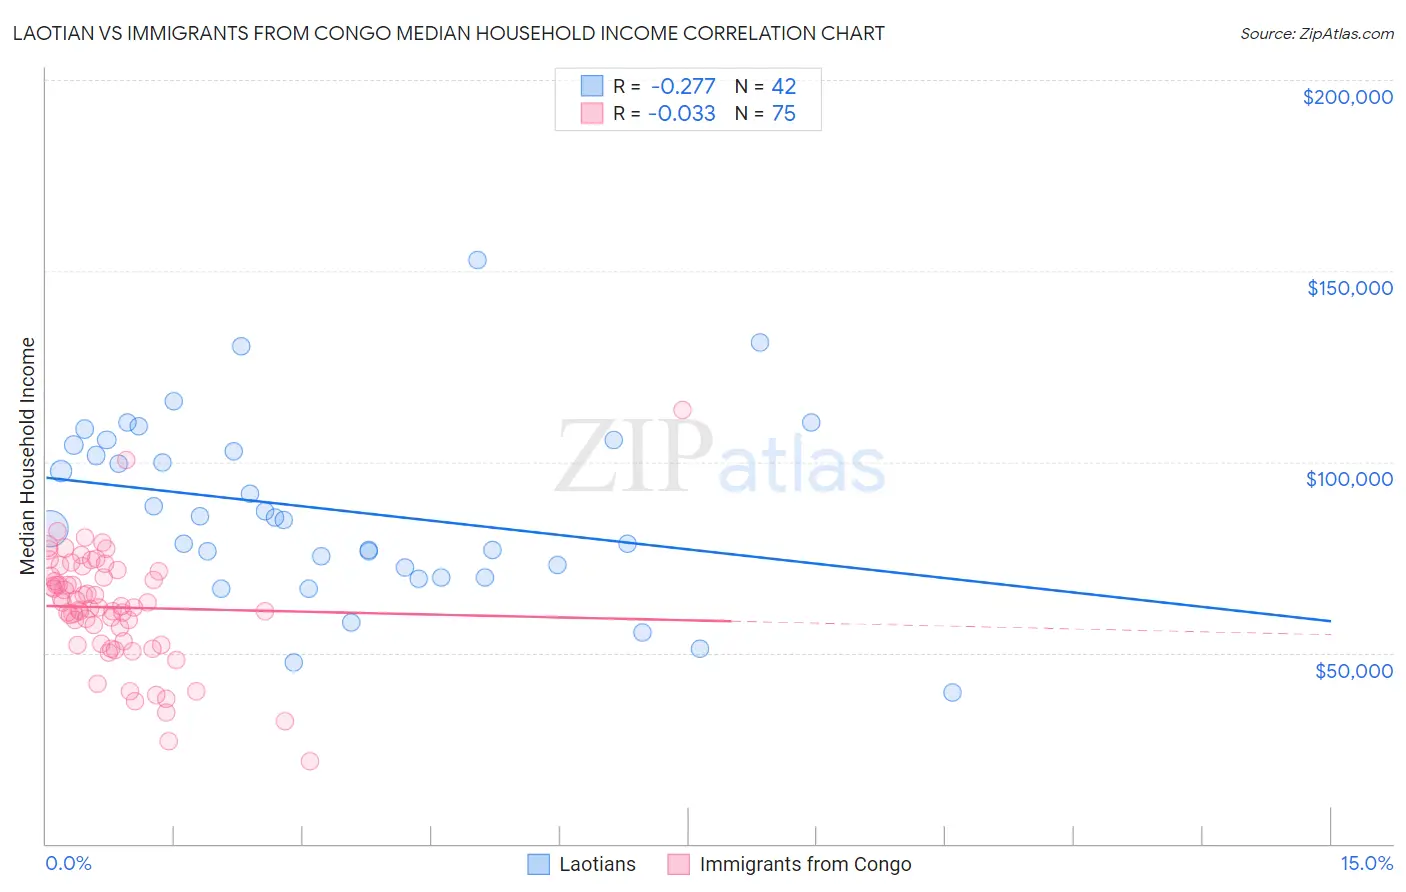
Laotian vs Immigrants from Congo Median Household Income Correlation Chart
The statistical analysis conducted on geographies consisting of 224,713,642 people shows a weak negative correlation between the proportion of Laotians and median household income in the United States with a correlation coefficient (R) of -0.277 and weighted average of $94,990. Similarly, the statistical analysis conducted on geographies consisting of 92,065,095 people shows no correlation between the proportion of Immigrants from Congo and median household income in the United States with a correlation coefficient (R) of -0.033 and weighted average of $66,768, a difference of 42.3%.
Median Household Income Correlation Summary
| Measurement | Laotian | Immigrants from Congo |
| Minimum | $39,542 | $21,567 |
| Maximum | $153,021 | $113,664 |
| Range | $113,479 | $92,097 |
| Mean | $87,400 | $61,890 |
| Median | $85,171 | $62,087 |
| Interquartile 25% (IQ1) | $72,352 | $52,383 |
| Interquartile 75% (IQ3) | $104,389 | $71,250 |
| Interquartile Range (IQR) | $32,037 | $18,867 |
| Standard Deviation (Sample) | $23,584 | $15,094 |
| Standard Deviation (Population) | $23,302 | $14,993 |
Similar Demographics by Median Household Income
Demographics Similar to Laotians by Median Household Income
In terms of median household income, the demographic groups most similar to Laotians are Korean ($95,018, a difference of 0.030%), Immigrants from Europe ($95,032, a difference of 0.040%), Soviet Union ($95,098, a difference of 0.11%), Immigrants from Norway ($94,846, a difference of 0.15%), and New Zealander ($95,146, a difference of 0.16%).
| Demographics | Rating | Rank | Median Household Income |
| Egyptians | 99.9 /100 | #54 | Exceptional $95,673 |
| Immigrants | Czechoslovakia | 99.9 /100 | #55 | Exceptional $95,319 |
| Immigrants | Austria | 99.9 /100 | #56 | Exceptional $95,277 |
| New Zealanders | 99.8 /100 | #57 | Exceptional $95,146 |
| Soviet Union | 99.8 /100 | #58 | Exceptional $95,098 |
| Immigrants | Europe | 99.8 /100 | #59 | Exceptional $95,032 |
| Koreans | 99.8 /100 | #60 | Exceptional $95,018 |
| Laotians | 99.8 /100 | #61 | Exceptional $94,990 |
| Immigrants | Norway | 99.8 /100 | #62 | Exceptional $94,846 |
| Greeks | 99.8 /100 | #63 | Exceptional $94,735 |
| Immigrants | Netherlands | 99.7 /100 | #64 | Exceptional $94,411 |
| Immigrants | Belarus | 99.7 /100 | #65 | Exceptional $94,399 |
| Immigrants | Romania | 99.7 /100 | #66 | Exceptional $94,222 |
| Immigrants | Scotland | 99.7 /100 | #67 | Exceptional $94,091 |
| Mongolians | 99.7 /100 | #68 | Exceptional $93,971 |
Demographics Similar to Immigrants from Congo by Median Household Income
In terms of median household income, the demographic groups most similar to Immigrants from Congo are Cheyenne ($66,974, a difference of 0.31%), Black/African American ($67,573, a difference of 1.2%), Kiowa ($65,914, a difference of 1.3%), Creek ($67,715, a difference of 1.4%), and Sioux ($67,792, a difference of 1.5%).
| Demographics | Rating | Rank | Median Household Income |
| Dutch West Indians | 0.0 /100 | #329 | Tragic $68,412 |
| Arapaho | 0.0 /100 | #330 | Tragic $67,965 |
| Natives/Alaskans | 0.0 /100 | #331 | Tragic $67,879 |
| Sioux | 0.0 /100 | #332 | Tragic $67,792 |
| Creek | 0.0 /100 | #333 | Tragic $67,715 |
| Blacks/African Americans | 0.0 /100 | #334 | Tragic $67,573 |
| Cheyenne | 0.0 /100 | #335 | Tragic $66,974 |
| Immigrants | Congo | 0.0 /100 | #336 | Tragic $66,768 |
| Kiowa | 0.0 /100 | #337 | Tragic $65,914 |
| Immigrants | Yemen | 0.0 /100 | #338 | Tragic $65,194 |
| Hopi | 0.0 /100 | #339 | Tragic $65,043 |
| Pueblo | 0.0 /100 | #340 | Tragic $64,692 |
| Crow | 0.0 /100 | #341 | Tragic $63,681 |
| Pima | 0.0 /100 | #342 | Tragic $63,262 |
| Houma | 0.0 /100 | #343 | Tragic $62,575 |