Laotian vs Immigrants from Turkey Median Household Income
COMPARE
Laotian
Immigrants from Turkey
Median Household Income
Median Household Income Comparison
Laotians
Immigrants from Turkey
$94,990
MEDIAN HOUSEHOLD INCOME
99.8/ 100
METRIC RATING
61st/ 347
METRIC RANK
$96,964
MEDIAN HOUSEHOLD INCOME
100.0/ 100
METRIC RATING
41st/ 347
METRIC RANK
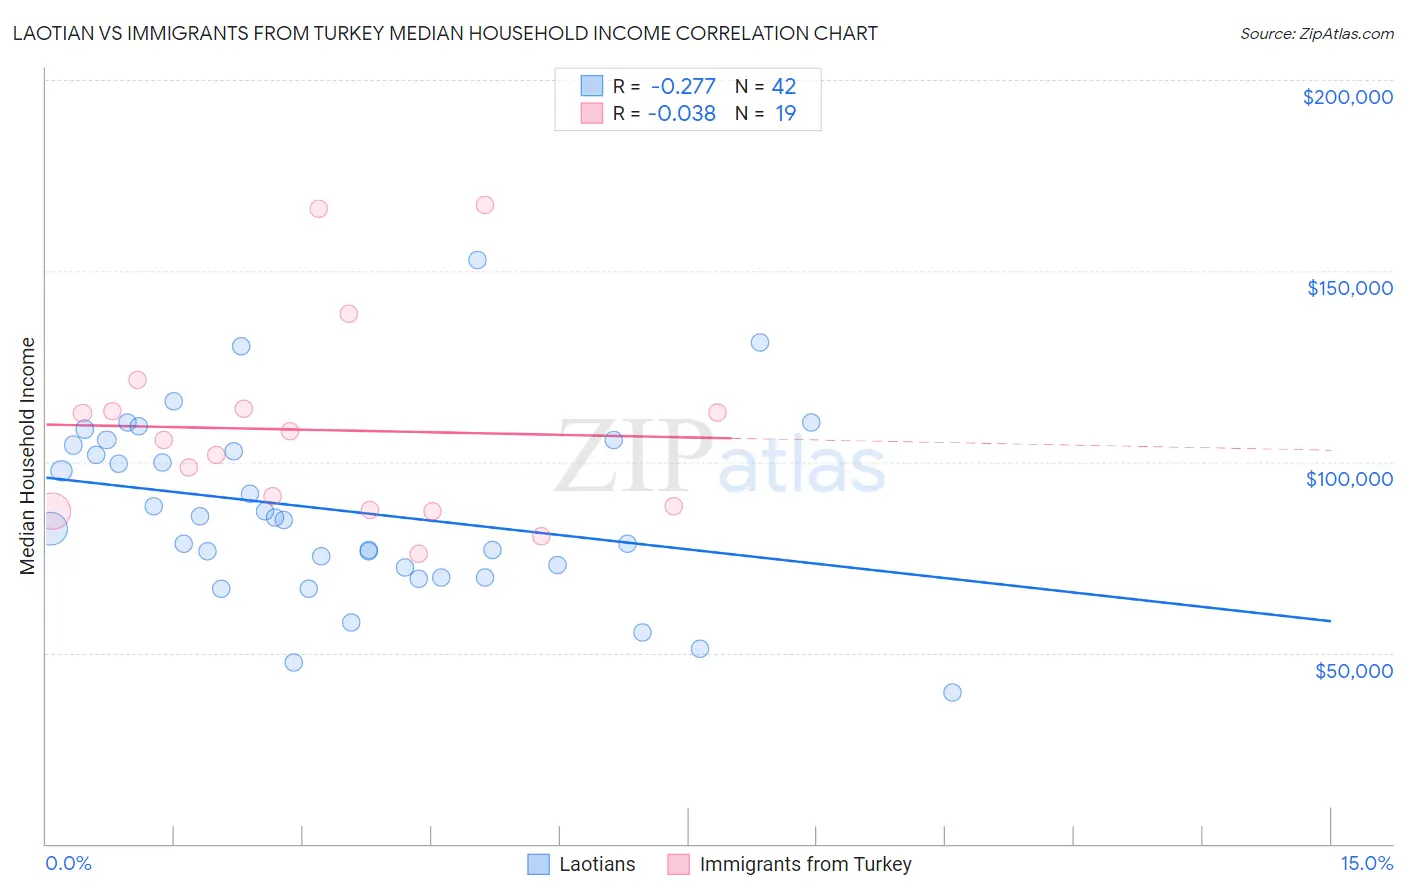
Laotian vs Immigrants from Turkey Median Household Income Correlation Chart
The statistical analysis conducted on geographies consisting of 224,713,642 people shows a weak negative correlation between the proportion of Laotians and median household income in the United States with a correlation coefficient (R) of -0.277 and weighted average of $94,990. Similarly, the statistical analysis conducted on geographies consisting of 222,938,856 people shows no correlation between the proportion of Immigrants from Turkey and median household income in the United States with a correlation coefficient (R) of -0.038 and weighted average of $96,964, a difference of 2.1%.
Median Household Income Correlation Summary
| Measurement | Laotian | Immigrants from Turkey |
| Minimum | $39,542 | $75,893 |
| Maximum | $153,021 | $167,317 |
| Range | $113,479 | $91,424 |
| Mean | $87,400 | $108,335 |
| Median | $85,171 | $105,608 |
| Interquartile 25% (IQ1) | $72,352 | $87,245 |
| Interquartile 75% (IQ3) | $104,389 | $113,867 |
| Interquartile Range (IQR) | $32,037 | $26,622 |
| Standard Deviation (Sample) | $23,584 | $25,883 |
| Standard Deviation (Population) | $23,302 | $25,193 |
Demographics Similar to Laotians and Immigrants from Turkey by Median Household Income
In terms of median household income, the demographic groups most similar to Laotians are Korean ($95,018, a difference of 0.030%), Immigrants from Europe ($95,032, a difference of 0.040%), Soviet Union ($95,098, a difference of 0.11%), New Zealander ($95,146, a difference of 0.16%), and Immigrants from Austria ($95,277, a difference of 0.30%). Similarly, the demographic groups most similar to Immigrants from Turkey are Immigrants from Lithuania ($96,836, a difference of 0.13%), Immigrants from France ($96,743, a difference of 0.23%), Immigrants from Greece ($96,675, a difference of 0.30%), Israeli ($96,552, a difference of 0.43%), and Australian ($96,490, a difference of 0.49%).
| Demographics | Rating | Rank | Median Household Income |
| Immigrants | Turkey | 100.0 /100 | #41 | Exceptional $96,964 |
| Immigrants | Lithuania | 99.9 /100 | #42 | Exceptional $96,836 |
| Immigrants | France | 99.9 /100 | #43 | Exceptional $96,743 |
| Immigrants | Greece | 99.9 /100 | #44 | Exceptional $96,675 |
| Israelis | 99.9 /100 | #45 | Exceptional $96,552 |
| Australians | 99.9 /100 | #46 | Exceptional $96,490 |
| Immigrants | Russia | 99.9 /100 | #47 | Exceptional $96,378 |
| Cambodians | 99.9 /100 | #48 | Exceptional $96,324 |
| Immigrants | Malaysia | 99.9 /100 | #49 | Exceptional $96,292 |
| Bulgarians | 99.9 /100 | #50 | Exceptional $96,290 |
| Estonians | 99.9 /100 | #51 | Exceptional $95,930 |
| Immigrants | South Africa | 99.9 /100 | #52 | Exceptional $95,800 |
| Paraguayans | 99.9 /100 | #53 | Exceptional $95,737 |
| Egyptians | 99.9 /100 | #54 | Exceptional $95,673 |
| Immigrants | Czechoslovakia | 99.9 /100 | #55 | Exceptional $95,319 |
| Immigrants | Austria | 99.9 /100 | #56 | Exceptional $95,277 |
| New Zealanders | 99.8 /100 | #57 | Exceptional $95,146 |
| Soviet Union | 99.8 /100 | #58 | Exceptional $95,098 |
| Immigrants | Europe | 99.8 /100 | #59 | Exceptional $95,032 |
| Koreans | 99.8 /100 | #60 | Exceptional $95,018 |
| Laotians | 99.8 /100 | #61 | Exceptional $94,990 |