Laotian vs Immigrants from Congo Female Disability
COMPARE
Laotian
Immigrants from Congo
Female Disability
Female Disability Comparison
Laotians
Immigrants from Congo
11.4%
FEMALE DISABILITY
99.9/ 100
METRIC RATING
58th/ 347
METRIC RANK
12.7%
FEMALE DISABILITY
1.8/ 100
METRIC RATING
249th/ 347
METRIC RANK
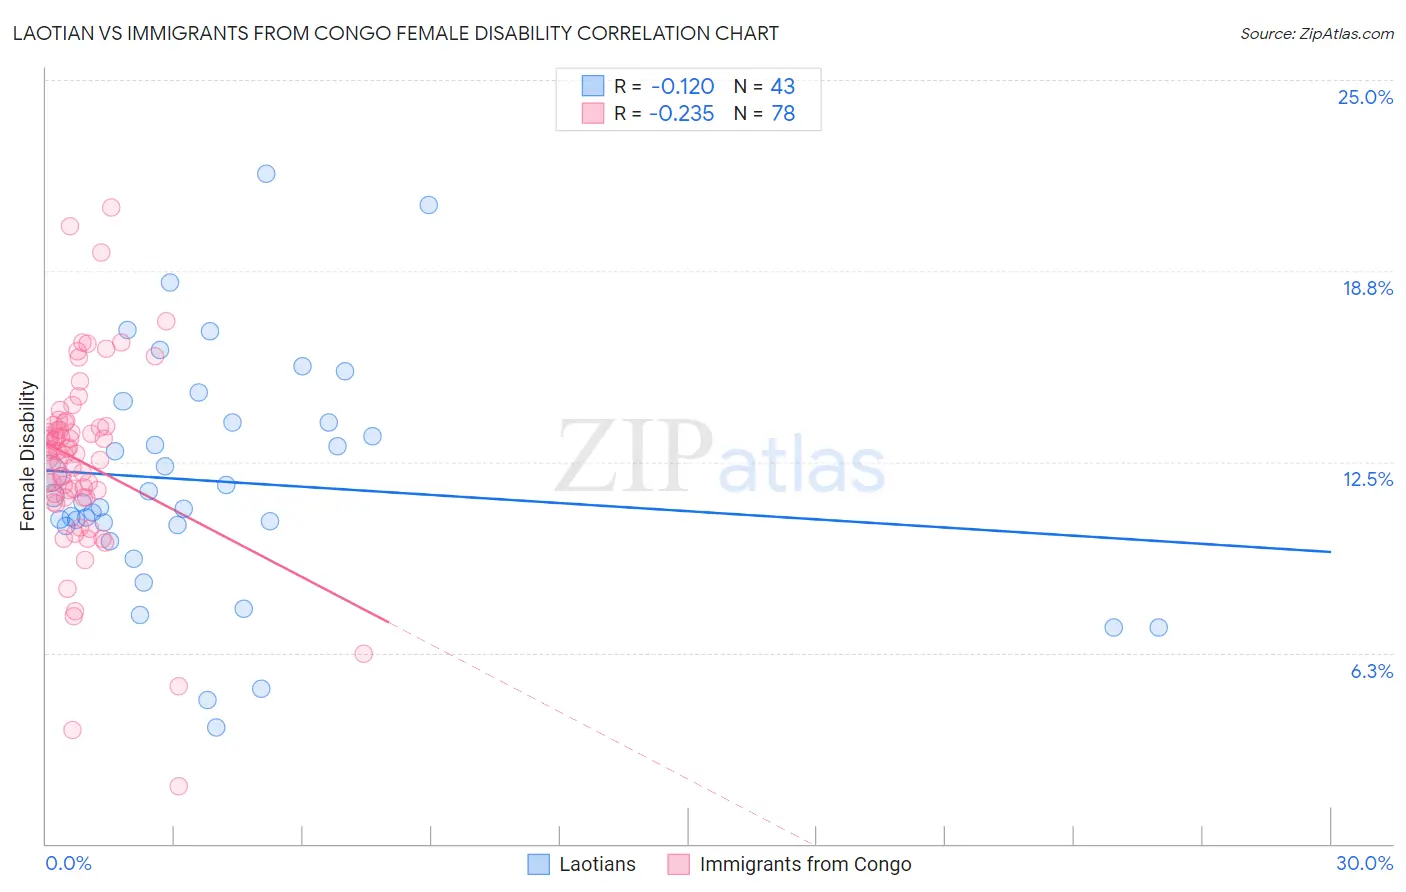
Laotian vs Immigrants from Congo Female Disability Correlation Chart
The statistical analysis conducted on geographies consisting of 224,852,766 people shows a poor negative correlation between the proportion of Laotians and percentage of females with a disability in the United States with a correlation coefficient (R) of -0.120 and weighted average of 11.4%. Similarly, the statistical analysis conducted on geographies consisting of 92,114,824 people shows a weak negative correlation between the proportion of Immigrants from Congo and percentage of females with a disability in the United States with a correlation coefficient (R) of -0.235 and weighted average of 12.7%, a difference of 11.3%.
Female Disability Correlation Summary
| Measurement | Laotian | Immigrants from Congo |
| Minimum | 3.8% | 1.9% |
| Maximum | 21.9% | 20.8% |
| Range | 18.1% | 19.0% |
| Mean | 11.8% | 12.5% |
| Median | 11.2% | 12.8% |
| Interquartile 25% (IQ1) | 10.4% | 11.4% |
| Interquartile 75% (IQ3) | 13.8% | 13.7% |
| Interquartile Range (IQR) | 3.4% | 2.3% |
| Standard Deviation (Sample) | 3.9% | 3.1% |
| Standard Deviation (Population) | 3.8% | 3.1% |
Similar Demographics by Female Disability
Demographics Similar to Laotians by Female Disability
In terms of female disability, the demographic groups most similar to Laotians are South American (11.4%, a difference of 0.020%), Taiwanese (11.4%, a difference of 0.090%), Immigrants from Spain (11.4%, a difference of 0.13%), Immigrants from Bulgaria (11.4%, a difference of 0.25%), and Immigrants from France (11.4%, a difference of 0.31%).
| Demographics | Rating | Rank | Female Disability |
| Immigrants | Belgium | 100.0 /100 | #51 | Exceptional 11.3% |
| Immigrants | Peru | 99.9 /100 | #52 | Exceptional 11.3% |
| Immigrants | Saudi Arabia | 99.9 /100 | #53 | Exceptional 11.3% |
| Peruvians | 99.9 /100 | #54 | Exceptional 11.3% |
| Bulgarians | 99.9 /100 | #55 | Exceptional 11.3% |
| Taiwanese | 99.9 /100 | #56 | Exceptional 11.4% |
| South Americans | 99.9 /100 | #57 | Exceptional 11.4% |
| Laotians | 99.9 /100 | #58 | Exceptional 11.4% |
| Immigrants | Spain | 99.9 /100 | #59 | Exceptional 11.4% |
| Immigrants | Bulgaria | 99.9 /100 | #60 | Exceptional 11.4% |
| Immigrants | France | 99.9 /100 | #61 | Exceptional 11.4% |
| Sri Lankans | 99.9 /100 | #62 | Exceptional 11.4% |
| Immigrants | Colombia | 99.9 /100 | #63 | Exceptional 11.4% |
| Immigrants | El Salvador | 99.9 /100 | #64 | Exceptional 11.4% |
| Immigrants | South America | 99.9 /100 | #65 | Exceptional 11.4% |
Demographics Similar to Immigrants from Congo by Female Disability
In terms of female disability, the demographic groups most similar to Immigrants from Congo are Slovene (12.7%, a difference of 0.040%), Crow (12.7%, a difference of 0.10%), Carpatho Rusyn (12.6%, a difference of 0.13%), Menominee (12.6%, a difference of 0.16%), and Spanish American Indian (12.6%, a difference of 0.18%).
| Demographics | Rating | Rank | Female Disability |
| Canadians | 2.6 /100 | #242 | Tragic 12.6% |
| Immigrants | Senegal | 2.5 /100 | #243 | Tragic 12.6% |
| Alsatians | 2.5 /100 | #244 | Tragic 12.6% |
| Immigrants | Jamaica | 2.2 /100 | #245 | Tragic 12.6% |
| Spanish American Indians | 2.1 /100 | #246 | Tragic 12.6% |
| Menominee | 2.1 /100 | #247 | Tragic 12.6% |
| Carpatho Rusyns | 2.0 /100 | #248 | Tragic 12.6% |
| Immigrants | Congo | 1.8 /100 | #249 | Tragic 12.7% |
| Slovenes | 1.7 /100 | #250 | Tragic 12.7% |
| Crow | 1.6 /100 | #251 | Tragic 12.7% |
| Immigrants | Caribbean | 1.4 /100 | #252 | Tragic 12.7% |
| Jamaicans | 1.4 /100 | #253 | Tragic 12.7% |
| Hawaiians | 1.4 /100 | #254 | Tragic 12.7% |
| Immigrants | Germany | 1.3 /100 | #255 | Tragic 12.7% |
| British West Indians | 1.2 /100 | #256 | Tragic 12.7% |