Bahamian vs Immigrants from Congo Median Household Income
COMPARE
Bahamian
Immigrants from Congo
Median Household Income
Median Household Income Comparison
Bahamians
Immigrants from Congo
$69,726
MEDIAN HOUSEHOLD INCOME
0.0/ 100
METRIC RATING
323rd/ 347
METRIC RANK
$66,768
MEDIAN HOUSEHOLD INCOME
0.0/ 100
METRIC RATING
336th/ 347
METRIC RANK
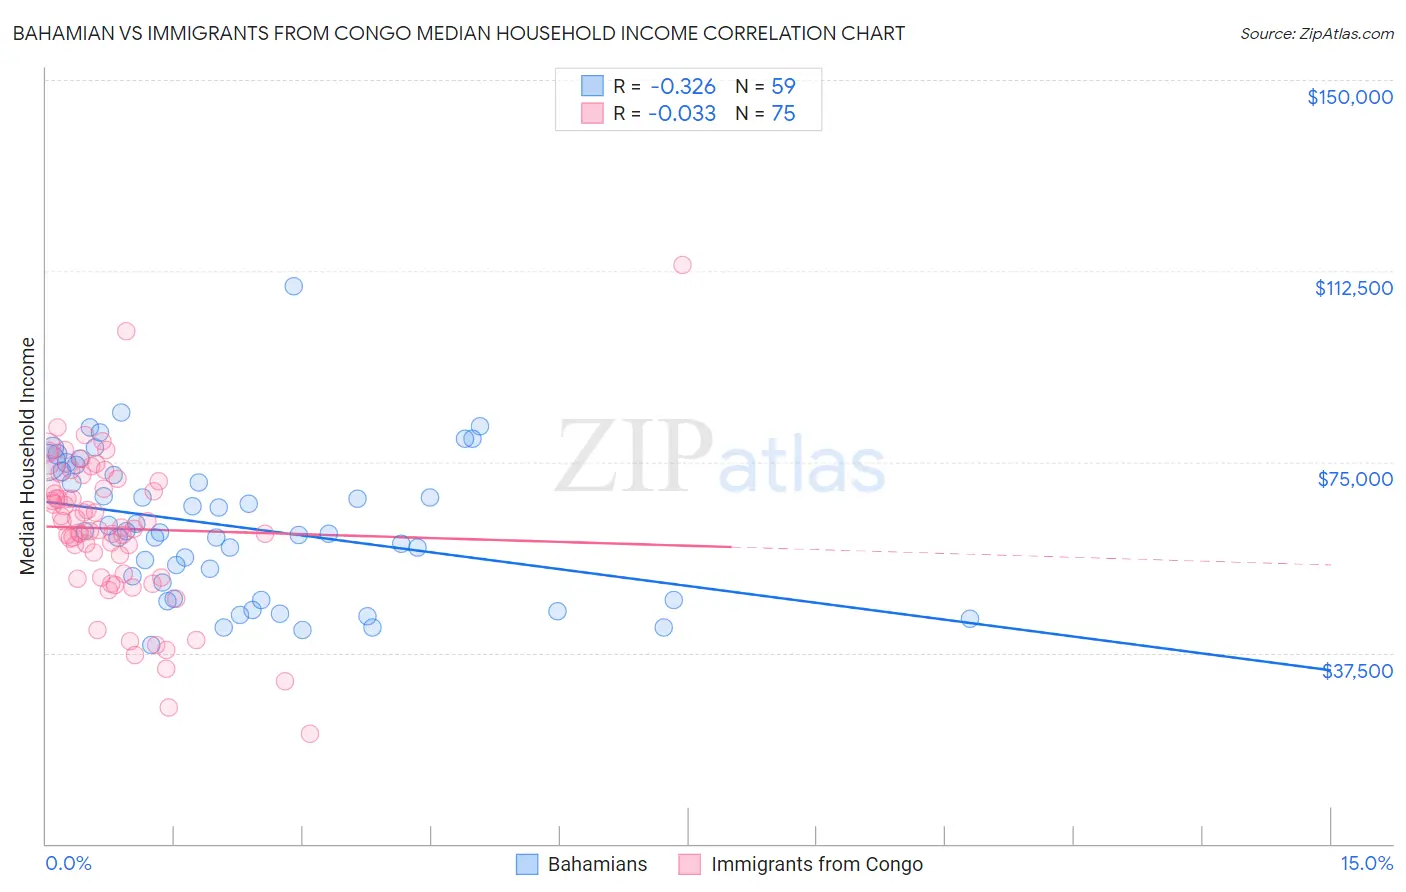
Bahamian vs Immigrants from Congo Median Household Income Correlation Chart
The statistical analysis conducted on geographies consisting of 112,607,468 people shows a mild negative correlation between the proportion of Bahamians and median household income in the United States with a correlation coefficient (R) of -0.326 and weighted average of $69,726. Similarly, the statistical analysis conducted on geographies consisting of 92,065,095 people shows no correlation between the proportion of Immigrants from Congo and median household income in the United States with a correlation coefficient (R) of -0.033 and weighted average of $66,768, a difference of 4.4%.
Median Household Income Correlation Summary
| Measurement | Bahamian | Immigrants from Congo |
| Minimum | $38,952 | $21,567 |
| Maximum | $109,393 | $113,664 |
| Range | $70,441 | $92,097 |
| Mean | $62,193 | $61,890 |
| Median | $61,085 | $62,087 |
| Interquartile 25% (IQ1) | $48,214 | $52,383 |
| Interquartile 75% (IQ3) | $73,042 | $71,250 |
| Interquartile Range (IQR) | $24,828 | $18,867 |
| Standard Deviation (Sample) | $14,104 | $15,094 |
| Standard Deviation (Population) | $13,984 | $14,993 |
Demographics Similar to Bahamians and Immigrants from Congo by Median Household Income
In terms of median household income, the demographic groups most similar to Bahamians are Yup'ik ($69,695, a difference of 0.040%), Choctaw ($69,947, a difference of 0.32%), Chickasaw ($70,005, a difference of 0.40%), Seminole ($69,420, a difference of 0.44%), and Colville ($70,094, a difference of 0.53%). Similarly, the demographic groups most similar to Immigrants from Congo are Cheyenne ($66,974, a difference of 0.31%), Black/African American ($67,573, a difference of 1.2%), Kiowa ($65,914, a difference of 1.3%), Creek ($67,715, a difference of 1.4%), and Sioux ($67,792, a difference of 1.5%).
| Demographics | Rating | Rank | Median Household Income |
| Immigrants | Dominican Republic | 0.0 /100 | #319 | Tragic $70,208 |
| Colville | 0.0 /100 | #320 | Tragic $70,094 |
| Chickasaw | 0.0 /100 | #321 | Tragic $70,005 |
| Choctaw | 0.0 /100 | #322 | Tragic $69,947 |
| Bahamians | 0.0 /100 | #323 | Tragic $69,726 |
| Yup'ik | 0.0 /100 | #324 | Tragic $69,695 |
| Seminole | 0.0 /100 | #325 | Tragic $69,420 |
| Yuman | 0.0 /100 | #326 | Tragic $68,743 |
| Immigrants | Cuba | 0.0 /100 | #327 | Tragic $68,461 |
| Menominee | 0.0 /100 | #328 | Tragic $68,423 |
| Dutch West Indians | 0.0 /100 | #329 | Tragic $68,412 |
| Arapaho | 0.0 /100 | #330 | Tragic $67,965 |
| Natives/Alaskans | 0.0 /100 | #331 | Tragic $67,879 |
| Sioux | 0.0 /100 | #332 | Tragic $67,792 |
| Creek | 0.0 /100 | #333 | Tragic $67,715 |
| Blacks/African Americans | 0.0 /100 | #334 | Tragic $67,573 |
| Cheyenne | 0.0 /100 | #335 | Tragic $66,974 |
| Immigrants | Congo | 0.0 /100 | #336 | Tragic $66,768 |
| Kiowa | 0.0 /100 | #337 | Tragic $65,914 |
| Immigrants | Yemen | 0.0 /100 | #338 | Tragic $65,194 |
| Hopi | 0.0 /100 | #339 | Tragic $65,043 |