Laotian vs Turkish Median Household Income
COMPARE
Laotian
Turkish
Median Household Income
Median Household Income Comparison
Laotians
Turks
$94,990
MEDIAN HOUSEHOLD INCOME
99.8/ 100
METRIC RATING
61st/ 347
METRIC RANK
$99,389
MEDIAN HOUSEHOLD INCOME
100.0/ 100
METRIC RATING
31st/ 347
METRIC RANK
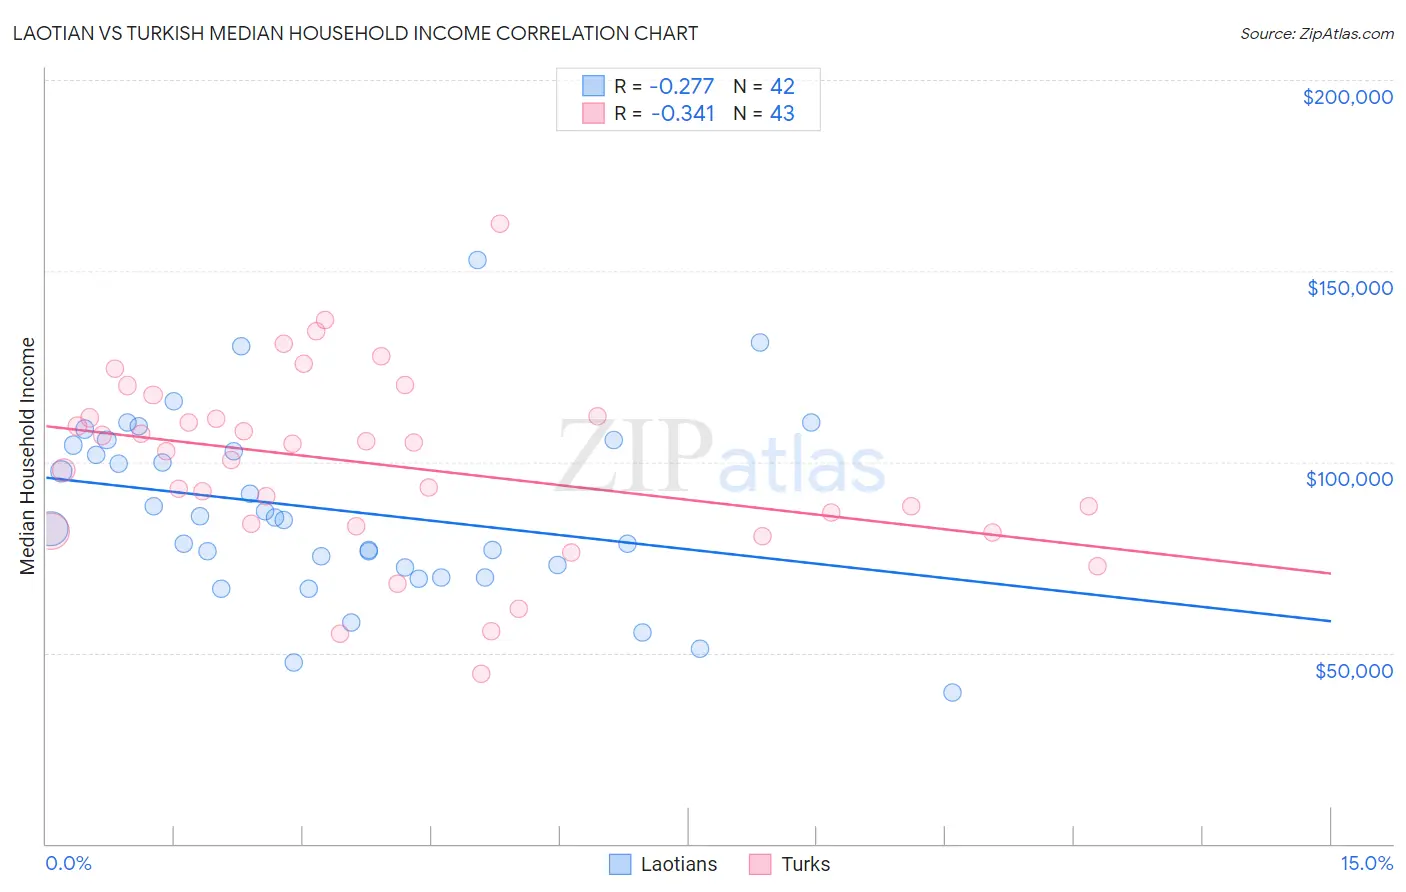
Laotian vs Turkish Median Household Income Correlation Chart
The statistical analysis conducted on geographies consisting of 224,713,642 people shows a weak negative correlation between the proportion of Laotians and median household income in the United States with a correlation coefficient (R) of -0.277 and weighted average of $94,990. Similarly, the statistical analysis conducted on geographies consisting of 271,658,597 people shows a mild negative correlation between the proportion of Turks and median household income in the United States with a correlation coefficient (R) of -0.341 and weighted average of $99,389, a difference of 4.6%.
Median Household Income Correlation Summary
| Measurement | Laotian | Turkish |
| Minimum | $39,542 | $44,531 |
| Maximum | $153,021 | $162,391 |
| Range | $113,479 | $117,860 |
| Mean | $87,400 | $99,338 |
| Median | $85,171 | $102,665 |
| Interquartile 25% (IQ1) | $72,352 | $83,043 |
| Interquartile 75% (IQ3) | $104,389 | $112,097 |
| Interquartile Range (IQR) | $32,037 | $29,054 |
| Standard Deviation (Sample) | $23,584 | $24,163 |
| Standard Deviation (Population) | $23,302 | $23,880 |
Similar Demographics by Median Household Income
Demographics Similar to Laotians by Median Household Income
In terms of median household income, the demographic groups most similar to Laotians are Korean ($95,018, a difference of 0.030%), Immigrants from Europe ($95,032, a difference of 0.040%), Soviet Union ($95,098, a difference of 0.11%), Immigrants from Norway ($94,846, a difference of 0.15%), and New Zealander ($95,146, a difference of 0.16%).
| Demographics | Rating | Rank | Median Household Income |
| Egyptians | 99.9 /100 | #54 | Exceptional $95,673 |
| Immigrants | Czechoslovakia | 99.9 /100 | #55 | Exceptional $95,319 |
| Immigrants | Austria | 99.9 /100 | #56 | Exceptional $95,277 |
| New Zealanders | 99.8 /100 | #57 | Exceptional $95,146 |
| Soviet Union | 99.8 /100 | #58 | Exceptional $95,098 |
| Immigrants | Europe | 99.8 /100 | #59 | Exceptional $95,032 |
| Koreans | 99.8 /100 | #60 | Exceptional $95,018 |
| Laotians | 99.8 /100 | #61 | Exceptional $94,990 |
| Immigrants | Norway | 99.8 /100 | #62 | Exceptional $94,846 |
| Greeks | 99.8 /100 | #63 | Exceptional $94,735 |
| Immigrants | Netherlands | 99.7 /100 | #64 | Exceptional $94,411 |
| Immigrants | Belarus | 99.7 /100 | #65 | Exceptional $94,399 |
| Immigrants | Romania | 99.7 /100 | #66 | Exceptional $94,222 |
| Immigrants | Scotland | 99.7 /100 | #67 | Exceptional $94,091 |
| Mongolians | 99.7 /100 | #68 | Exceptional $93,971 |
Demographics Similar to Turks by Median Household Income
In terms of median household income, the demographic groups most similar to Turks are Immigrants from Northern Europe ($99,813, a difference of 0.43%), Immigrants from Asia ($99,933, a difference of 0.55%), Immigrants from Sri Lanka ($99,943, a difference of 0.56%), Bhutanese ($100,151, a difference of 0.77%), and Immigrants from Denmark ($98,510, a difference of 0.89%).
| Demographics | Rating | Rank | Median Household Income |
| Immigrants | Japan | 100.0 /100 | #24 | Exceptional $100,711 |
| Immigrants | Sweden | 100.0 /100 | #25 | Exceptional $100,699 |
| Immigrants | Belgium | 100.0 /100 | #26 | Exceptional $100,306 |
| Bhutanese | 100.0 /100 | #27 | Exceptional $100,151 |
| Immigrants | Sri Lanka | 100.0 /100 | #28 | Exceptional $99,943 |
| Immigrants | Asia | 100.0 /100 | #29 | Exceptional $99,933 |
| Immigrants | Northern Europe | 100.0 /100 | #30 | Exceptional $99,813 |
| Turks | 100.0 /100 | #31 | Exceptional $99,389 |
| Immigrants | Denmark | 100.0 /100 | #32 | Exceptional $98,510 |
| Chinese | 100.0 /100 | #33 | Exceptional $98,496 |
| Russians | 100.0 /100 | #34 | Exceptional $98,008 |
| Immigrants | Switzerland | 100.0 /100 | #35 | Exceptional $97,979 |
| Immigrants | Pakistan | 100.0 /100 | #36 | Exceptional $97,528 |
| Latvians | 100.0 /100 | #37 | Exceptional $97,311 |
| Immigrants | Indonesia | 100.0 /100 | #38 | Exceptional $97,297 |