Laotian vs Immigrants from China Median Household Income
COMPARE
Laotian
Immigrants from China
Median Household Income
Median Household Income Comparison
Laotians
Immigrants from China
$94,990
MEDIAN HOUSEHOLD INCOME
99.8/ 100
METRIC RATING
61st/ 347
METRIC RANK
$105,335
MEDIAN HOUSEHOLD INCOME
100.0/ 100
METRIC RATING
11th/ 347
METRIC RANK
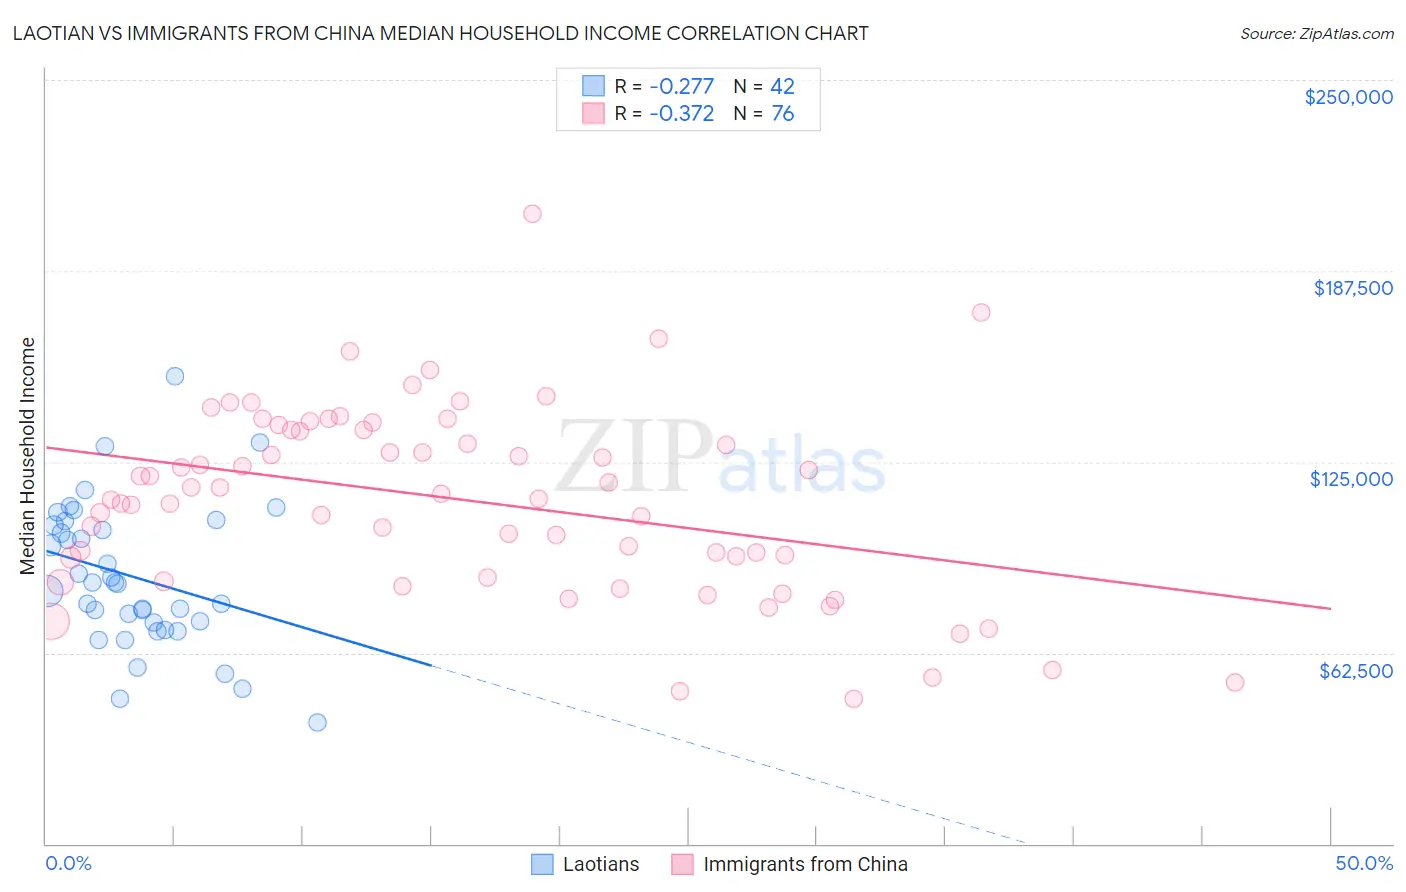
Laotian vs Immigrants from China Median Household Income Correlation Chart
The statistical analysis conducted on geographies consisting of 224,713,642 people shows a weak negative correlation between the proportion of Laotians and median household income in the United States with a correlation coefficient (R) of -0.277 and weighted average of $94,990. Similarly, the statistical analysis conducted on geographies consisting of 456,448,801 people shows a mild negative correlation between the proportion of Immigrants from China and median household income in the United States with a correlation coefficient (R) of -0.372 and weighted average of $105,335, a difference of 10.9%.
Median Household Income Correlation Summary
| Measurement | Laotian | Immigrants from China |
| Minimum | $39,542 | $47,386 |
| Maximum | $153,021 | $206,336 |
| Range | $113,479 | $158,950 |
| Mean | $87,400 | $112,457 |
| Median | $85,171 | $113,740 |
| Interquartile 25% (IQ1) | $72,352 | $90,379 |
| Interquartile 75% (IQ3) | $104,389 | $135,564 |
| Interquartile Range (IQR) | $32,037 | $45,185 |
| Standard Deviation (Sample) | $23,584 | $30,829 |
| Standard Deviation (Population) | $23,302 | $30,625 |
Similar Demographics by Median Household Income
Demographics Similar to Laotians by Median Household Income
In terms of median household income, the demographic groups most similar to Laotians are Korean ($95,018, a difference of 0.030%), Immigrants from Europe ($95,032, a difference of 0.040%), Soviet Union ($95,098, a difference of 0.11%), Immigrants from Norway ($94,846, a difference of 0.15%), and New Zealander ($95,146, a difference of 0.16%).
| Demographics | Rating | Rank | Median Household Income |
| Egyptians | 99.9 /100 | #54 | Exceptional $95,673 |
| Immigrants | Czechoslovakia | 99.9 /100 | #55 | Exceptional $95,319 |
| Immigrants | Austria | 99.9 /100 | #56 | Exceptional $95,277 |
| New Zealanders | 99.8 /100 | #57 | Exceptional $95,146 |
| Soviet Union | 99.8 /100 | #58 | Exceptional $95,098 |
| Immigrants | Europe | 99.8 /100 | #59 | Exceptional $95,032 |
| Koreans | 99.8 /100 | #60 | Exceptional $95,018 |
| Laotians | 99.8 /100 | #61 | Exceptional $94,990 |
| Immigrants | Norway | 99.8 /100 | #62 | Exceptional $94,846 |
| Greeks | 99.8 /100 | #63 | Exceptional $94,735 |
| Immigrants | Netherlands | 99.7 /100 | #64 | Exceptional $94,411 |
| Immigrants | Belarus | 99.7 /100 | #65 | Exceptional $94,399 |
| Immigrants | Romania | 99.7 /100 | #66 | Exceptional $94,222 |
| Immigrants | Scotland | 99.7 /100 | #67 | Exceptional $94,091 |
| Mongolians | 99.7 /100 | #68 | Exceptional $93,971 |
Demographics Similar to Immigrants from China by Median Household Income
In terms of median household income, the demographic groups most similar to Immigrants from China are Indian (Asian) ($105,262, a difference of 0.070%), Immigrants from Eastern Asia ($104,796, a difference of 0.51%), Immigrants from Ireland ($104,692, a difference of 0.61%), Immigrants from South Central Asia ($106,057, a difference of 0.69%), and Immigrants from Israel ($104,090, a difference of 1.2%).
| Demographics | Rating | Rank | Median Household Income |
| Immigrants | Hong Kong | 100.0 /100 | #4 | Exceptional $111,519 |
| Thais | 100.0 /100 | #5 | Exceptional $110,648 |
| Immigrants | Singapore | 100.0 /100 | #6 | Exceptional $110,428 |
| Iranians | 100.0 /100 | #7 | Exceptional $109,835 |
| Immigrants | Iran | 100.0 /100 | #8 | Exceptional $108,055 |
| Okinawans | 100.0 /100 | #9 | Exceptional $106,624 |
| Immigrants | South Central Asia | 100.0 /100 | #10 | Exceptional $106,057 |
| Immigrants | China | 100.0 /100 | #11 | Exceptional $105,335 |
| Indians (Asian) | 100.0 /100 | #12 | Exceptional $105,262 |
| Immigrants | Eastern Asia | 100.0 /100 | #13 | Exceptional $104,796 |
| Immigrants | Ireland | 100.0 /100 | #14 | Exceptional $104,692 |
| Immigrants | Israel | 100.0 /100 | #15 | Exceptional $104,090 |
| Burmese | 100.0 /100 | #16 | Exceptional $103,145 |
| Immigrants | Korea | 100.0 /100 | #17 | Exceptional $102,962 |
| Cypriots | 100.0 /100 | #18 | Exceptional $102,843 |