Vietnamese vs Immigrants from Korea Median Male Earnings
COMPARE
Vietnamese
Immigrants from Korea
Median Male Earnings
Median Male Earnings Comparison
Vietnamese
Immigrants from Korea
$52,525
MEDIAN MALE EARNINGS
12.7/ 100
METRIC RATING
207th/ 347
METRIC RANK
$65,079
MEDIAN MALE EARNINGS
100.0/ 100
METRIC RATING
23rd/ 347
METRIC RANK
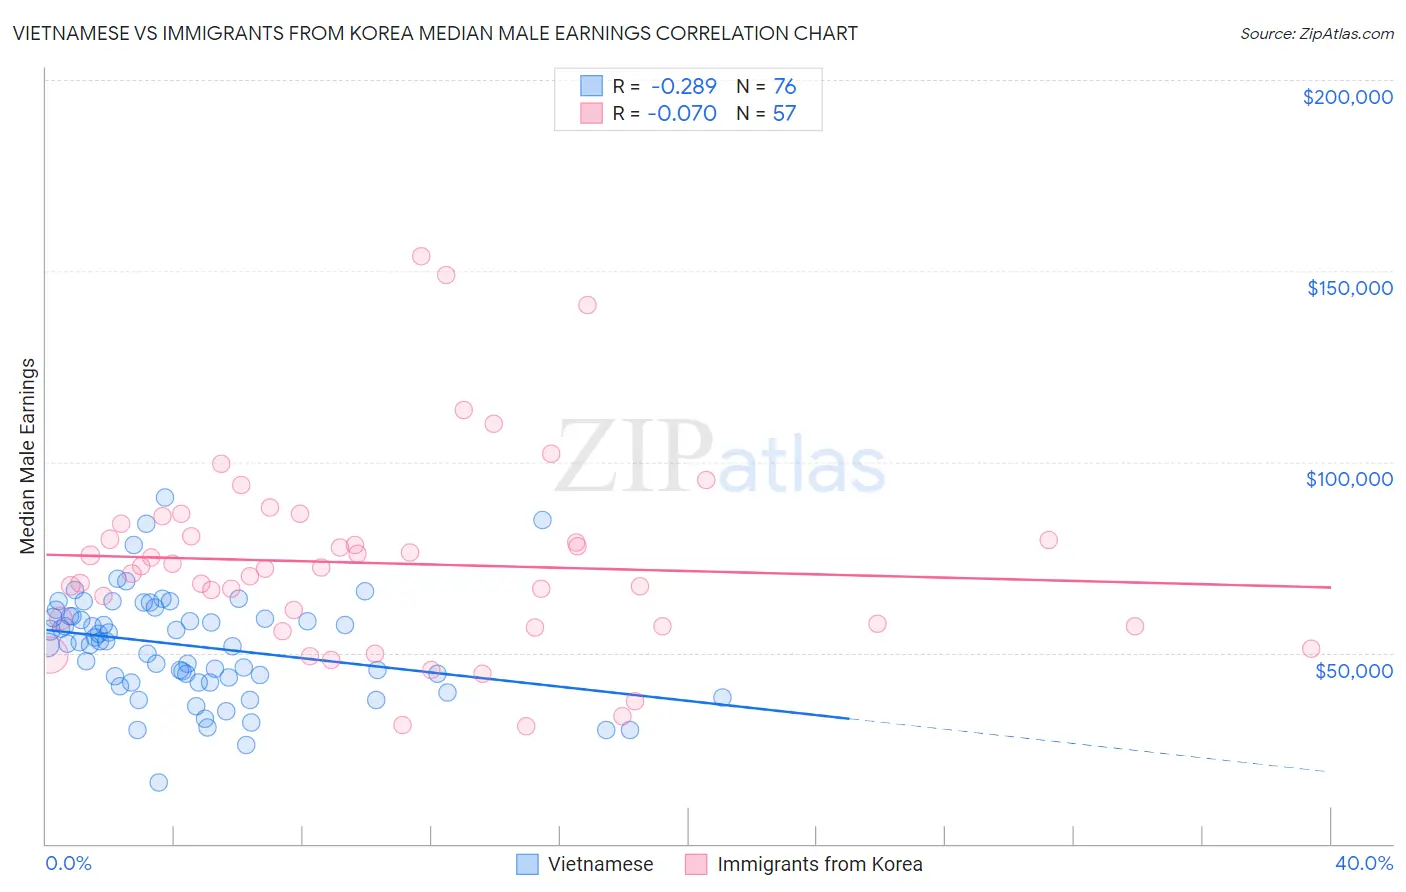
Vietnamese vs Immigrants from Korea Median Male Earnings Correlation Chart
The statistical analysis conducted on geographies consisting of 170,734,633 people shows a weak negative correlation between the proportion of Vietnamese and median male earnings in the United States with a correlation coefficient (R) of -0.289 and weighted average of $52,525. Similarly, the statistical analysis conducted on geographies consisting of 416,203,155 people shows a slight negative correlation between the proportion of Immigrants from Korea and median male earnings in the United States with a correlation coefficient (R) of -0.070 and weighted average of $65,079, a difference of 23.9%.
Median Male Earnings Correlation Summary
| Measurement | Vietnamese | Immigrants from Korea |
| Minimum | $16,146 | $30,795 |
| Maximum | $90,827 | $153,870 |
| Range | $74,681 | $123,075 |
| Mean | $51,791 | $73,429 |
| Median | $52,846 | $71,921 |
| Interquartile 25% (IQ1) | $43,003 | $56,978 |
| Interquartile 75% (IQ3) | $59,635 | $82,188 |
| Interquartile Range (IQR) | $16,633 | $25,211 |
| Standard Deviation (Sample) | $13,801 | $25,444 |
| Standard Deviation (Population) | $13,710 | $25,220 |
Similar Demographics by Median Male Earnings
Demographics Similar to Vietnamese by Median Male Earnings
In terms of median male earnings, the demographic groups most similar to Vietnamese are Venezuelan ($52,510, a difference of 0.030%), Bermudan ($52,465, a difference of 0.11%), Delaware ($52,412, a difference of 0.22%), Tlingit-Haida ($52,409, a difference of 0.22%), and Immigrants from Iraq ($52,681, a difference of 0.30%).
| Demographics | Rating | Rank | Median Male Earnings |
| Immigrants | Thailand | 17.5 /100 | #200 | Poor $52,908 |
| Immigrants | Bosnia and Herzegovina | 16.9 /100 | #201 | Poor $52,869 |
| Immigrants | Uruguay | 16.8 /100 | #202 | Poor $52,860 |
| Panamanians | 16.5 /100 | #203 | Poor $52,835 |
| Ghanaians | 16.1 /100 | #204 | Poor $52,810 |
| Immigrants | Colombia | 15.0 /100 | #205 | Poor $52,725 |
| Immigrants | Iraq | 14.5 /100 | #206 | Poor $52,681 |
| Vietnamese | 12.7 /100 | #207 | Poor $52,525 |
| Venezuelans | 12.5 /100 | #208 | Poor $52,510 |
| Bermudans | 12.1 /100 | #209 | Poor $52,465 |
| Delaware | 11.5 /100 | #210 | Poor $52,412 |
| Tlingit-Haida | 11.5 /100 | #211 | Poor $52,409 |
| Cajuns | 10.7 /100 | #212 | Poor $52,325 |
| Native Hawaiians | 10.5 /100 | #213 | Poor $52,306 |
| Immigrants | Nonimmigrants | 9.3 /100 | #214 | Tragic $52,170 |
Demographics Similar to Immigrants from Korea by Median Male Earnings
In terms of median male earnings, the demographic groups most similar to Immigrants from Korea are Immigrants from Northern Europe ($64,987, a difference of 0.14%), Burmese ($65,236, a difference of 0.24%), Immigrants from Sweden ($65,406, a difference of 0.50%), Immigrants from Japan ($65,518, a difference of 0.67%), and Immigrants from Denmark ($64,625, a difference of 0.70%).
| Demographics | Rating | Rank | Median Male Earnings |
| Eastern Europeans | 100.0 /100 | #16 | Exceptional $66,472 |
| Immigrants | Belgium | 100.0 /100 | #17 | Exceptional $66,125 |
| Indians (Asian) | 100.0 /100 | #18 | Exceptional $66,078 |
| Cypriots | 100.0 /100 | #19 | Exceptional $65,549 |
| Immigrants | Japan | 100.0 /100 | #20 | Exceptional $65,518 |
| Immigrants | Sweden | 100.0 /100 | #21 | Exceptional $65,406 |
| Burmese | 100.0 /100 | #22 | Exceptional $65,236 |
| Immigrants | Korea | 100.0 /100 | #23 | Exceptional $65,079 |
| Immigrants | Northern Europe | 100.0 /100 | #24 | Exceptional $64,987 |
| Immigrants | Denmark | 100.0 /100 | #25 | Exceptional $64,625 |
| Turks | 100.0 /100 | #26 | Exceptional $64,253 |
| Immigrants | Switzerland | 100.0 /100 | #27 | Exceptional $63,944 |
| Russians | 100.0 /100 | #28 | Exceptional $63,939 |
| Asians | 100.0 /100 | #29 | Exceptional $63,827 |
| Immigrants | France | 100.0 /100 | #30 | Exceptional $63,715 |