Korean vs Alaska Native Median Male Earnings
COMPARE
Korean
Alaska Native
Median Male Earnings
Median Male Earnings Comparison
Koreans
Alaska Natives
$56,672
MEDIAN MALE EARNINGS
89.4/ 100
METRIC RATING
130th/ 347
METRIC RANK
$49,711
MEDIAN MALE EARNINGS
0.9/ 100
METRIC RATING
256th/ 347
METRIC RANK
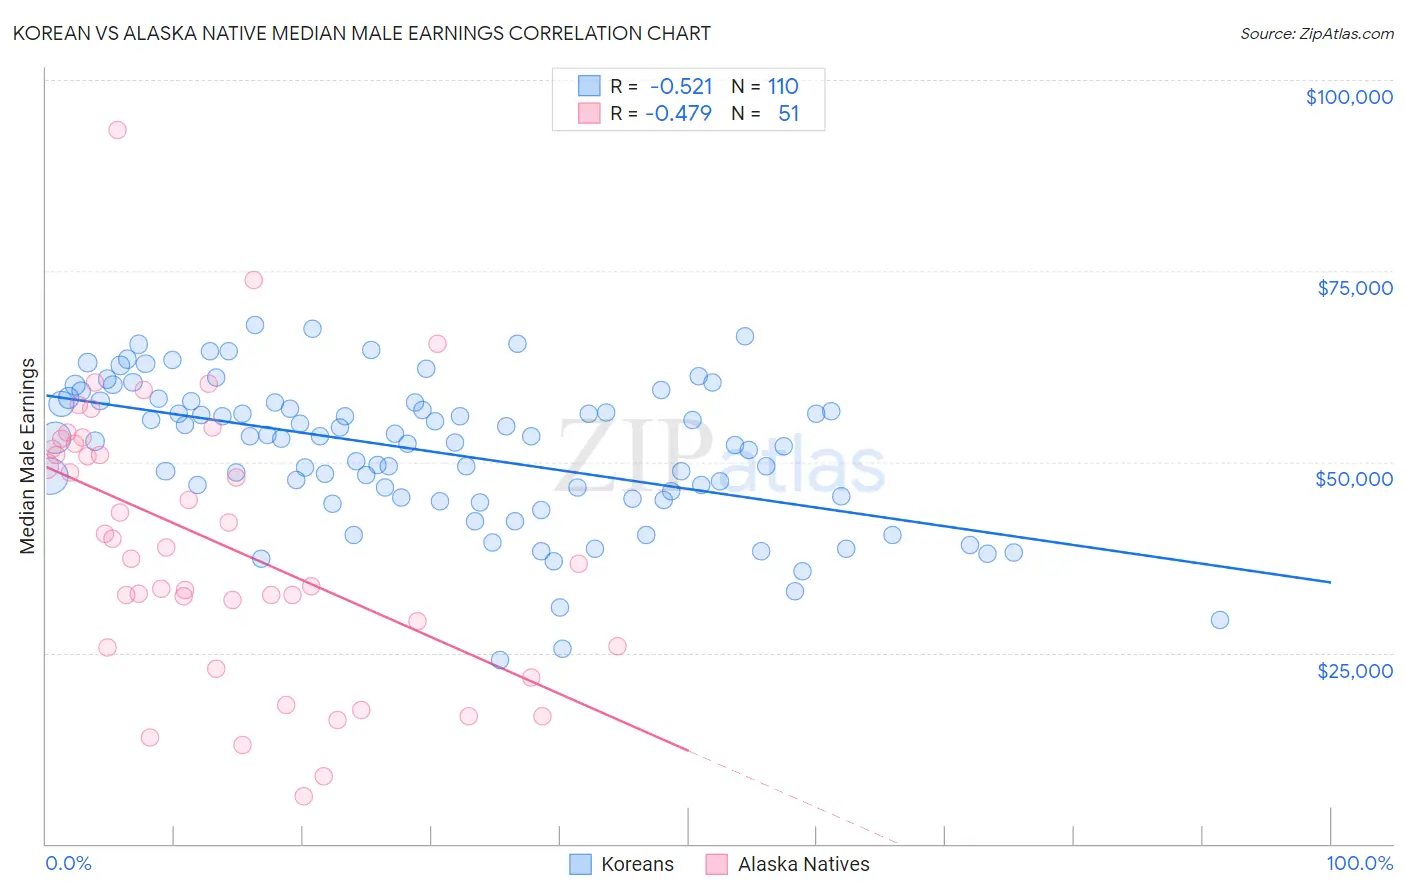
Korean vs Alaska Native Median Male Earnings Correlation Chart
The statistical analysis conducted on geographies consisting of 510,664,628 people shows a substantial negative correlation between the proportion of Koreans and median male earnings in the United States with a correlation coefficient (R) of -0.521 and weighted average of $56,672. Similarly, the statistical analysis conducted on geographies consisting of 76,751,910 people shows a moderate negative correlation between the proportion of Alaska Natives and median male earnings in the United States with a correlation coefficient (R) of -0.479 and weighted average of $49,711, a difference of 14.0%.
Median Male Earnings Correlation Summary
| Measurement | Korean | Alaska Native |
| Minimum | $24,028 | $6,250 |
| Maximum | $67,994 | $93,451 |
| Range | $43,966 | $87,201 |
| Mean | $51,299 | $39,521 |
| Median | $53,093 | $38,750 |
| Interquartile 25% (IQ1) | $45,357 | $25,833 |
| Interquartile 75% (IQ3) | $57,742 | $52,440 |
| Interquartile Range (IQR) | $12,385 | $26,607 |
| Standard Deviation (Sample) | $9,399 | $17,827 |
| Standard Deviation (Population) | $9,356 | $17,652 |
Similar Demographics by Median Male Earnings
Demographics Similar to Koreans by Median Male Earnings
In terms of median male earnings, the demographic groups most similar to Koreans are Portuguese ($56,663, a difference of 0.020%), Pakistani ($56,719, a difference of 0.080%), Czech ($56,546, a difference of 0.22%), Immigrants from Germany ($56,542, a difference of 0.23%), and Immigrants from Syria ($56,830, a difference of 0.28%).
| Demographics | Rating | Rank | Median Male Earnings |
| Slovenes | 93.1 /100 | #123 | Exceptional $57,145 |
| Chileans | 91.9 /100 | #124 | Exceptional $56,973 |
| Immigrants | Morocco | 91.8 /100 | #125 | Exceptional $56,958 |
| Chinese | 91.1 /100 | #126 | Exceptional $56,872 |
| Brazilians | 90.9 /100 | #127 | Exceptional $56,837 |
| Immigrants | Syria | 90.8 /100 | #128 | Exceptional $56,830 |
| Pakistanis | 89.9 /100 | #129 | Excellent $56,719 |
| Koreans | 89.4 /100 | #130 | Excellent $56,672 |
| Portuguese | 89.4 /100 | #131 | Excellent $56,663 |
| Czechs | 88.2 /100 | #132 | Excellent $56,546 |
| Immigrants | Germany | 88.2 /100 | #133 | Excellent $56,542 |
| Moroccans | 87.7 /100 | #134 | Excellent $56,499 |
| Irish | 87.4 /100 | #135 | Excellent $56,464 |
| Immigrants | Saudi Arabia | 87.2 /100 | #136 | Excellent $56,452 |
| Slavs | 86.5 /100 | #137 | Excellent $56,390 |
Demographics Similar to Alaska Natives by Median Male Earnings
In terms of median male earnings, the demographic groups most similar to Alaska Natives are Alaskan Athabascan ($49,748, a difference of 0.070%), Senegalese ($49,774, a difference of 0.13%), British West Indian ($49,636, a difference of 0.15%), German Russian ($49,924, a difference of 0.43%), and Cree ($49,497, a difference of 0.43%).
| Demographics | Rating | Rank | Median Male Earnings |
| Immigrants | Burma/Myanmar | 1.6 /100 | #249 | Tragic $50,298 |
| Osage | 1.6 /100 | #250 | Tragic $50,292 |
| Immigrants | Grenada | 1.6 /100 | #251 | Tragic $50,279 |
| Immigrants | Cabo Verde | 1.2 /100 | #252 | Tragic $50,009 |
| German Russians | 1.1 /100 | #253 | Tragic $49,924 |
| Senegalese | 1.0 /100 | #254 | Tragic $49,774 |
| Alaskan Athabascans | 0.9 /100 | #255 | Tragic $49,748 |
| Alaska Natives | 0.9 /100 | #256 | Tragic $49,711 |
| British West Indians | 0.8 /100 | #257 | Tragic $49,636 |
| Cree | 0.7 /100 | #258 | Tragic $49,497 |
| Nepalese | 0.7 /100 | #259 | Tragic $49,458 |
| Iroquois | 0.7 /100 | #260 | Tragic $49,374 |
| Liberians | 0.6 /100 | #261 | Tragic $49,318 |
| Immigrants | West Indies | 0.6 /100 | #262 | Tragic $49,271 |
| Nicaraguans | 0.6 /100 | #263 | Tragic $49,215 |