Immigrants from Ukraine vs European Median Family Income
COMPARE
Immigrants from Ukraine
European
Median Family Income
Median Family Income Comparison
Immigrants from Ukraine
Europeans
$109,645
MEDIAN FAMILY INCOME
97.2/ 100
METRIC RATING
101st/ 347
METRIC RANK
$108,099
MEDIAN FAMILY INCOME
94.1/ 100
METRIC RATING
121st/ 347
METRIC RANK
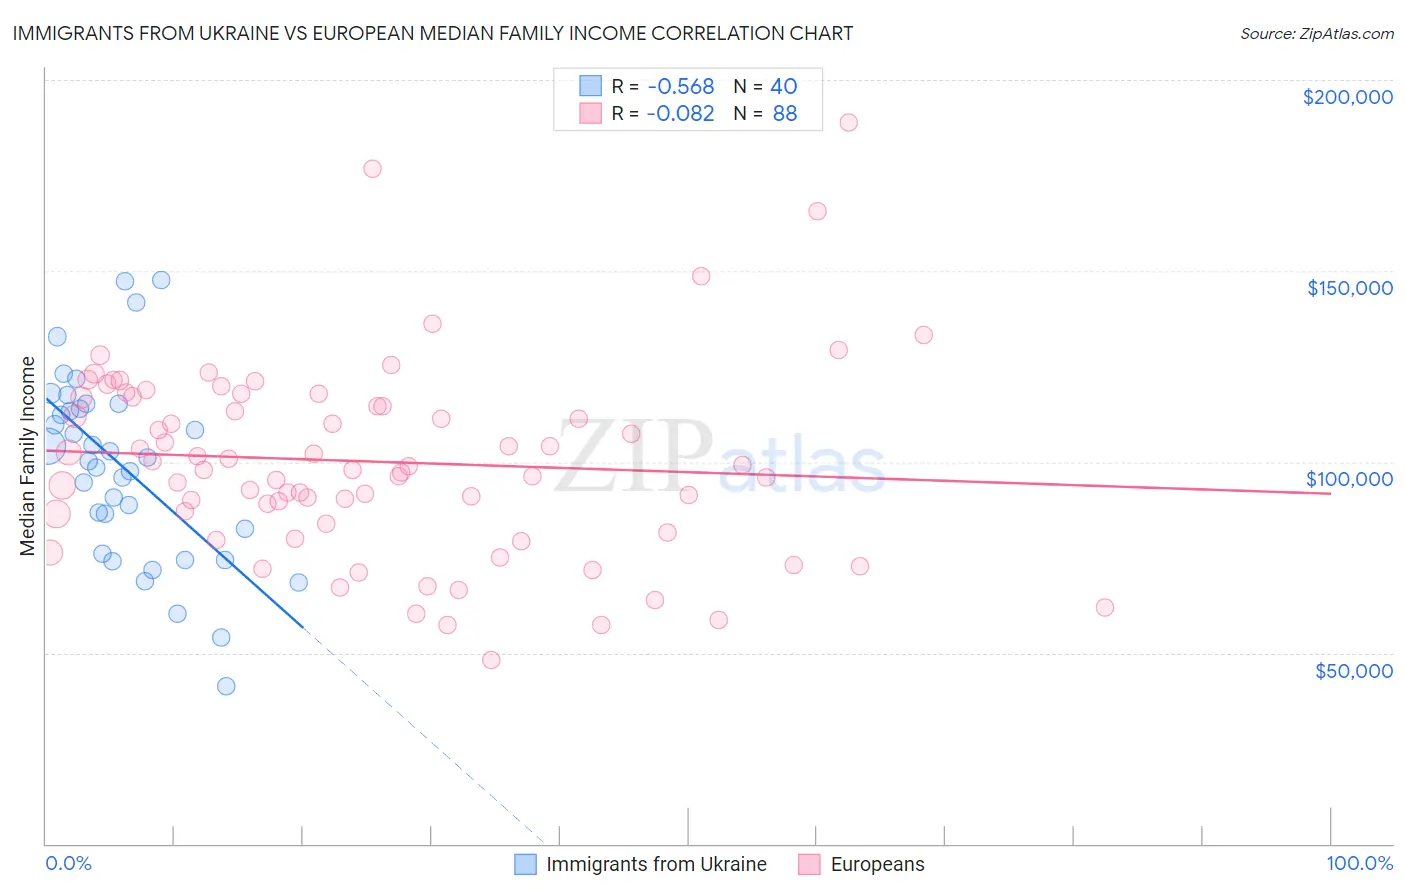
Immigrants from Ukraine vs European Median Family Income Correlation Chart
The statistical analysis conducted on geographies consisting of 289,573,478 people shows a substantial negative correlation between the proportion of Immigrants from Ukraine and median family income in the United States with a correlation coefficient (R) of -0.568 and weighted average of $109,645. Similarly, the statistical analysis conducted on geographies consisting of 560,683,121 people shows a slight negative correlation between the proportion of Europeans and median family income in the United States with a correlation coefficient (R) of -0.082 and weighted average of $108,099, a difference of 1.4%.
Median Family Income Correlation Summary
| Measurement | Immigrants from Ukraine | European |
| Minimum | $41,250 | $48,174 |
| Maximum | $147,711 | $188,913 |
| Range | $106,461 | $140,739 |
| Mean | $98,572 | $100,086 |
| Median | $100,738 | $98,374 |
| Interquartile 25% (IQ1) | $79,127 | $85,153 |
| Interquartile 75% (IQ3) | $114,676 | $116,940 |
| Interquartile Range (IQR) | $35,549 | $31,788 |
| Standard Deviation (Sample) | $24,600 | $25,416 |
| Standard Deviation (Population) | $24,291 | $25,271 |
Demographics Similar to Immigrants from Ukraine and Europeans by Median Family Income
In terms of median family income, the demographic groups most similar to Immigrants from Ukraine are Assyrian/Chaldean/Syriac ($109,622, a difference of 0.020%), Immigrants from Brazil ($109,418, a difference of 0.21%), Palestinian ($109,413, a difference of 0.21%), Syrian ($109,299, a difference of 0.32%), and Albanian ($109,136, a difference of 0.47%). Similarly, the demographic groups most similar to Europeans are Immigrants from Northern Africa ($108,161, a difference of 0.060%), Sri Lankan ($108,234, a difference of 0.12%), Ethiopian ($108,251, a difference of 0.14%), Immigrants from Philippines ($108,288, a difference of 0.18%), and Chilean ($108,429, a difference of 0.31%).
| Demographics | Rating | Rank | Median Family Income |
| Immigrants | Ukraine | 97.2 /100 | #101 | Exceptional $109,645 |
| Assyrians/Chaldeans/Syriacs | 97.2 /100 | #102 | Exceptional $109,622 |
| Immigrants | Brazil | 96.9 /100 | #103 | Exceptional $109,418 |
| Palestinians | 96.9 /100 | #104 | Exceptional $109,413 |
| Syrians | 96.7 /100 | #105 | Exceptional $109,299 |
| Albanians | 96.4 /100 | #106 | Exceptional $109,136 |
| Immigrants | North Macedonia | 96.4 /100 | #107 | Exceptional $109,136 |
| Immigrants | Zimbabwe | 95.9 /100 | #108 | Exceptional $108,830 |
| Immigrants | Afghanistan | 95.6 /100 | #109 | Exceptional $108,709 |
| British | 95.6 /100 | #110 | Exceptional $108,705 |
| Immigrants | Western Asia | 95.6 /100 | #111 | Exceptional $108,691 |
| Immigrants | Poland | 95.3 /100 | #112 | Exceptional $108,570 |
| Immigrants | Saudi Arabia | 95.2 /100 | #113 | Exceptional $108,544 |
| Poles | 95.2 /100 | #114 | Exceptional $108,507 |
| Swedes | 95.1 /100 | #115 | Exceptional $108,499 |
| Chileans | 95.0 /100 | #116 | Exceptional $108,429 |
| Immigrants | Philippines | 94.6 /100 | #117 | Exceptional $108,288 |
| Ethiopians | 94.5 /100 | #118 | Exceptional $108,251 |
| Sri Lankans | 94.5 /100 | #119 | Exceptional $108,234 |
| Immigrants | Northern Africa | 94.3 /100 | #120 | Exceptional $108,161 |
| Europeans | 94.1 /100 | #121 | Exceptional $108,099 |