Honduran vs European Median Family Income
COMPARE
Honduran
European
Median Family Income
Median Family Income Comparison
Hondurans
Europeans
$85,004
MEDIAN FAMILY INCOME
0.0/ 100
METRIC RATING
311th/ 347
METRIC RANK
$108,099
MEDIAN FAMILY INCOME
94.1/ 100
METRIC RATING
121st/ 347
METRIC RANK
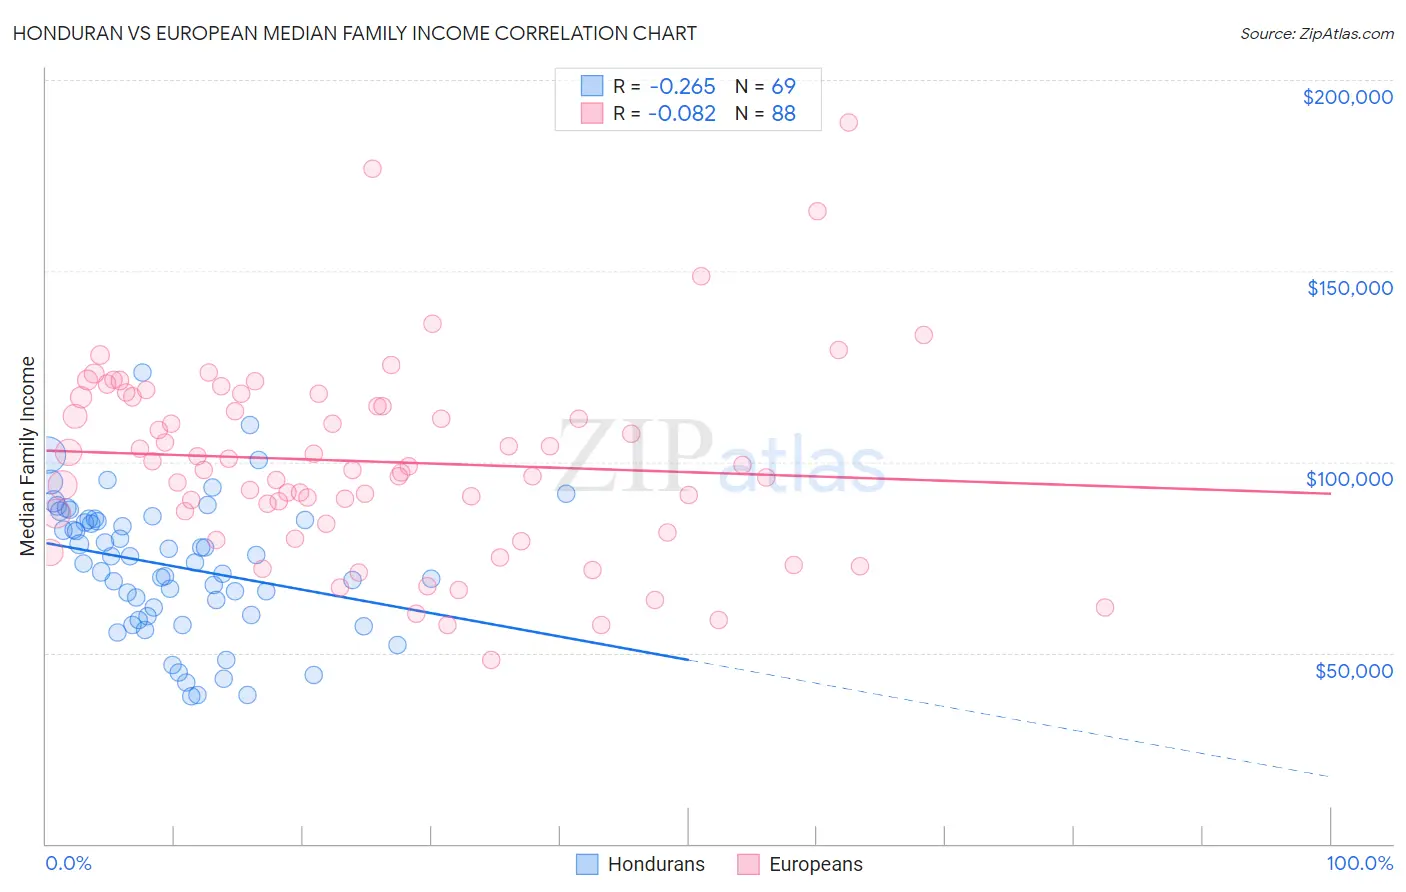
Honduran vs European Median Family Income Correlation Chart
The statistical analysis conducted on geographies consisting of 357,506,155 people shows a weak negative correlation between the proportion of Hondurans and median family income in the United States with a correlation coefficient (R) of -0.265 and weighted average of $85,004. Similarly, the statistical analysis conducted on geographies consisting of 560,683,121 people shows a slight negative correlation between the proportion of Europeans and median family income in the United States with a correlation coefficient (R) of -0.082 and weighted average of $108,099, a difference of 27.2%.
Median Family Income Correlation Summary
| Measurement | Honduran | European |
| Minimum | $38,552 | $48,174 |
| Maximum | $123,311 | $188,913 |
| Range | $84,759 | $140,739 |
| Mean | $72,692 | $100,086 |
| Median | $73,540 | $98,374 |
| Interquartile 25% (IQ1) | $59,714 | $85,153 |
| Interquartile 75% (IQ3) | $84,854 | $116,940 |
| Interquartile Range (IQR) | $25,140 | $31,788 |
| Standard Deviation (Sample) | $17,679 | $25,416 |
| Standard Deviation (Population) | $17,550 | $25,271 |
Similar Demographics by Median Family Income
Demographics Similar to Hondurans by Median Family Income
In terms of median family income, the demographic groups most similar to Hondurans are Cuban ($84,981, a difference of 0.030%), Immigrants from Central America ($85,050, a difference of 0.050%), Choctaw ($84,835, a difference of 0.20%), Haitian ($85,218, a difference of 0.25%), and Immigrants from Bahamas ($84,732, a difference of 0.32%).
| Demographics | Rating | Rank | Median Family Income |
| Mexicans | 0.0 /100 | #304 | Tragic $85,618 |
| Paiute | 0.0 /100 | #305 | Tragic $85,414 |
| Immigrants | Dominica | 0.0 /100 | #306 | Tragic $85,411 |
| Chickasaw | 0.0 /100 | #307 | Tragic $85,356 |
| U.S. Virgin Islanders | 0.0 /100 | #308 | Tragic $85,294 |
| Haitians | 0.0 /100 | #309 | Tragic $85,218 |
| Immigrants | Central America | 0.0 /100 | #310 | Tragic $85,050 |
| Hondurans | 0.0 /100 | #311 | Tragic $85,004 |
| Cubans | 0.0 /100 | #312 | Tragic $84,981 |
| Choctaw | 0.0 /100 | #313 | Tragic $84,835 |
| Immigrants | Bahamas | 0.0 /100 | #314 | Tragic $84,732 |
| Apache | 0.0 /100 | #315 | Tragic $84,451 |
| Immigrants | Haiti | 0.0 /100 | #316 | Tragic $84,018 |
| Yakama | 0.0 /100 | #317 | Tragic $83,932 |
| Immigrants | Mexico | 0.0 /100 | #318 | Tragic $83,639 |
Demographics Similar to Europeans by Median Family Income
In terms of median family income, the demographic groups most similar to Europeans are Immigrants from Northern Africa ($108,161, a difference of 0.060%), Sri Lankan ($108,234, a difference of 0.12%), Ethiopian ($108,251, a difference of 0.14%), Immigrants from Philippines ($108,288, a difference of 0.18%), and Chilean ($108,429, a difference of 0.31%).
| Demographics | Rating | Rank | Median Family Income |
| Poles | 95.2 /100 | #114 | Exceptional $108,507 |
| Swedes | 95.1 /100 | #115 | Exceptional $108,499 |
| Chileans | 95.0 /100 | #116 | Exceptional $108,429 |
| Immigrants | Philippines | 94.6 /100 | #117 | Exceptional $108,288 |
| Ethiopians | 94.5 /100 | #118 | Exceptional $108,251 |
| Sri Lankans | 94.5 /100 | #119 | Exceptional $108,234 |
| Immigrants | Northern Africa | 94.3 /100 | #120 | Exceptional $108,161 |
| Europeans | 94.1 /100 | #121 | Exceptional $108,099 |
| Immigrants | Jordan | 92.9 /100 | #122 | Exceptional $107,715 |
| Carpatho Rusyns | 92.2 /100 | #123 | Exceptional $107,502 |
| Pakistanis | 91.7 /100 | #124 | Exceptional $107,390 |
| Taiwanese | 91.4 /100 | #125 | Exceptional $107,295 |
| Serbians | 90.8 /100 | #126 | Exceptional $107,157 |
| Lebanese | 90.5 /100 | #127 | Exceptional $107,086 |
| Immigrants | Ethiopia | 90.0 /100 | #128 | Excellent $106,969 |