Immigrants from St. Vincent and the Grenadines vs European Median Family Income
COMPARE
Immigrants from St. Vincent and the Grenadines
European
Median Family Income
Median Family Income Comparison
Immigrants from St. Vincent and the Grenadines
Europeans
$90,094
MEDIAN FAMILY INCOME
0.2/ 100
METRIC RATING
275th/ 347
METRIC RANK
$108,099
MEDIAN FAMILY INCOME
94.1/ 100
METRIC RATING
121st/ 347
METRIC RANK
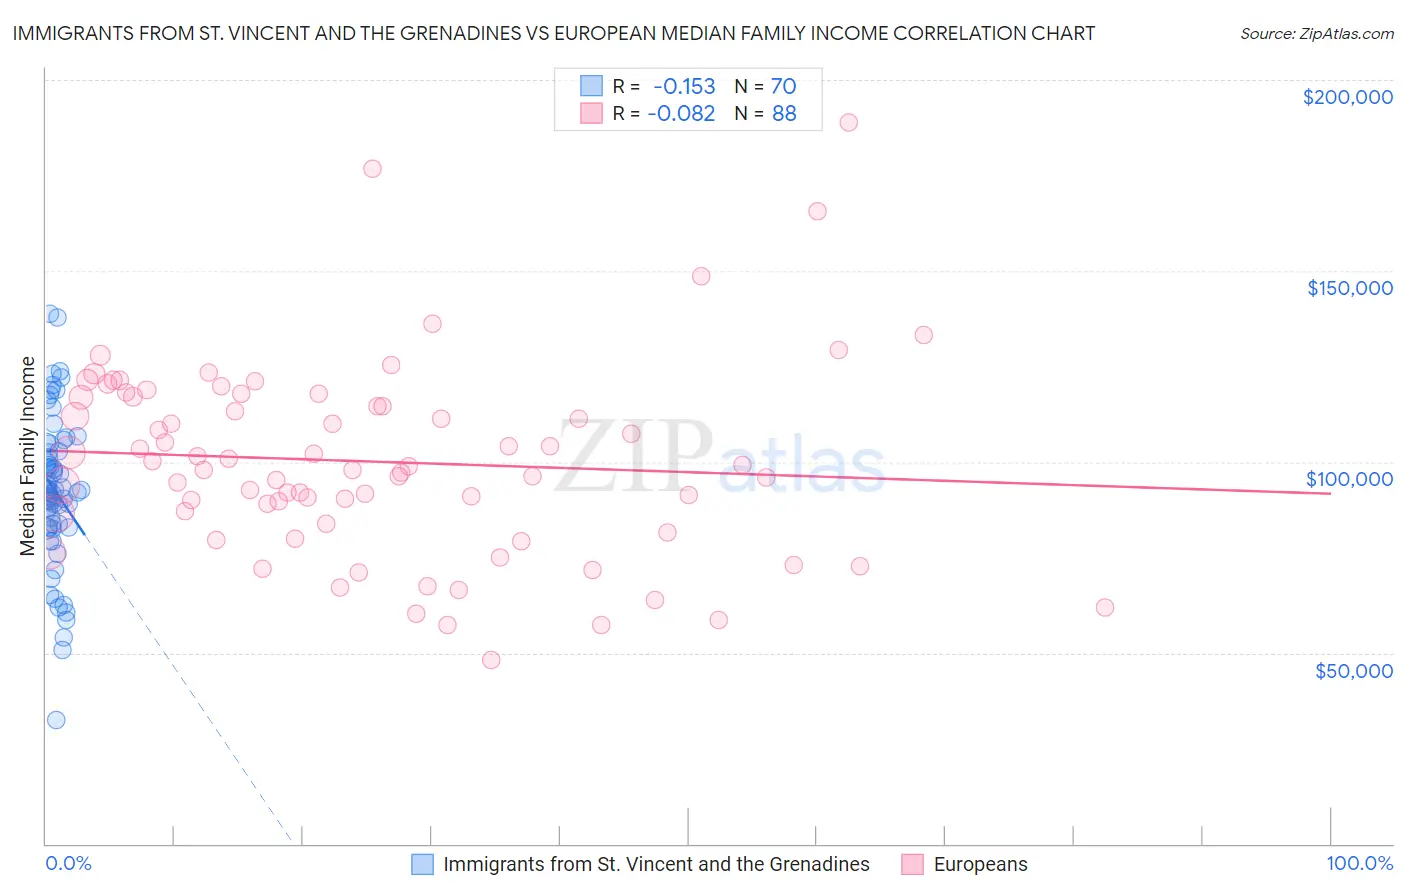
Immigrants from St. Vincent and the Grenadines vs European Median Family Income Correlation Chart
The statistical analysis conducted on geographies consisting of 56,186,074 people shows a poor negative correlation between the proportion of Immigrants from St. Vincent and the Grenadines and median family income in the United States with a correlation coefficient (R) of -0.153 and weighted average of $90,094. Similarly, the statistical analysis conducted on geographies consisting of 560,683,121 people shows a slight negative correlation between the proportion of Europeans and median family income in the United States with a correlation coefficient (R) of -0.082 and weighted average of $108,099, a difference of 20.0%.
Median Family Income Correlation Summary
| Measurement | Immigrants from St. Vincent and the Grenadines | European |
| Minimum | $32,289 | $48,174 |
| Maximum | $138,717 | $188,913 |
| Range | $106,428 | $140,739 |
| Mean | $92,358 | $100,086 |
| Median | $92,624 | $98,374 |
| Interquartile 25% (IQ1) | $82,866 | $85,153 |
| Interquartile 75% (IQ3) | $102,687 | $116,940 |
| Interquartile Range (IQR) | $19,821 | $31,788 |
| Standard Deviation (Sample) | $19,859 | $25,416 |
| Standard Deviation (Population) | $19,717 | $25,271 |
Similar Demographics by Median Family Income
Demographics Similar to Immigrants from St. Vincent and the Grenadines by Median Family Income
In terms of median family income, the demographic groups most similar to Immigrants from St. Vincent and the Grenadines are Spanish American ($90,322, a difference of 0.25%), Immigrants from Micronesia ($90,345, a difference of 0.28%), Immigrants from Liberia ($90,450, a difference of 0.40%), Iroquois ($90,543, a difference of 0.50%), and Jamaican ($90,581, a difference of 0.54%).
| Demographics | Rating | Rank | Median Family Income |
| Cree | 0.2 /100 | #268 | Tragic $90,882 |
| Belizeans | 0.2 /100 | #269 | Tragic $90,880 |
| Jamaicans | 0.2 /100 | #270 | Tragic $90,581 |
| Iroquois | 0.2 /100 | #271 | Tragic $90,543 |
| Immigrants | Liberia | 0.2 /100 | #272 | Tragic $90,450 |
| Immigrants | Micronesia | 0.2 /100 | #273 | Tragic $90,345 |
| Spanish Americans | 0.2 /100 | #274 | Tragic $90,322 |
| Immigrants | St. Vincent and the Grenadines | 0.2 /100 | #275 | Tragic $90,094 |
| Immigrants | Zaire | 0.1 /100 | #276 | Tragic $89,285 |
| Immigrants | Jamaica | 0.1 /100 | #277 | Tragic $89,268 |
| Immigrants | Grenada | 0.1 /100 | #278 | Tragic $89,249 |
| Immigrants | Belize | 0.1 /100 | #279 | Tragic $89,197 |
| British West Indians | 0.1 /100 | #280 | Tragic $88,987 |
| Blackfeet | 0.1 /100 | #281 | Tragic $88,717 |
| Comanche | 0.1 /100 | #282 | Tragic $88,556 |
Demographics Similar to Europeans by Median Family Income
In terms of median family income, the demographic groups most similar to Europeans are Immigrants from Northern Africa ($108,161, a difference of 0.060%), Sri Lankan ($108,234, a difference of 0.12%), Ethiopian ($108,251, a difference of 0.14%), Immigrants from Philippines ($108,288, a difference of 0.18%), and Chilean ($108,429, a difference of 0.31%).
| Demographics | Rating | Rank | Median Family Income |
| Poles | 95.2 /100 | #114 | Exceptional $108,507 |
| Swedes | 95.1 /100 | #115 | Exceptional $108,499 |
| Chileans | 95.0 /100 | #116 | Exceptional $108,429 |
| Immigrants | Philippines | 94.6 /100 | #117 | Exceptional $108,288 |
| Ethiopians | 94.5 /100 | #118 | Exceptional $108,251 |
| Sri Lankans | 94.5 /100 | #119 | Exceptional $108,234 |
| Immigrants | Northern Africa | 94.3 /100 | #120 | Exceptional $108,161 |
| Europeans | 94.1 /100 | #121 | Exceptional $108,099 |
| Immigrants | Jordan | 92.9 /100 | #122 | Exceptional $107,715 |
| Carpatho Rusyns | 92.2 /100 | #123 | Exceptional $107,502 |
| Pakistanis | 91.7 /100 | #124 | Exceptional $107,390 |
| Taiwanese | 91.4 /100 | #125 | Exceptional $107,295 |
| Serbians | 90.8 /100 | #126 | Exceptional $107,157 |
| Lebanese | 90.5 /100 | #127 | Exceptional $107,086 |
| Immigrants | Ethiopia | 90.0 /100 | #128 | Excellent $106,969 |