Immigrants from Ukraine vs Moroccan Median Family Income
COMPARE
Immigrants from Ukraine
Moroccan
Median Family Income
Median Family Income Comparison
Immigrants from Ukraine
Moroccans
$109,645
MEDIAN FAMILY INCOME
97.2/ 100
METRIC RATING
101st/ 347
METRIC RANK
$104,488
MEDIAN FAMILY INCOME
71.6/ 100
METRIC RATING
157th/ 347
METRIC RANK
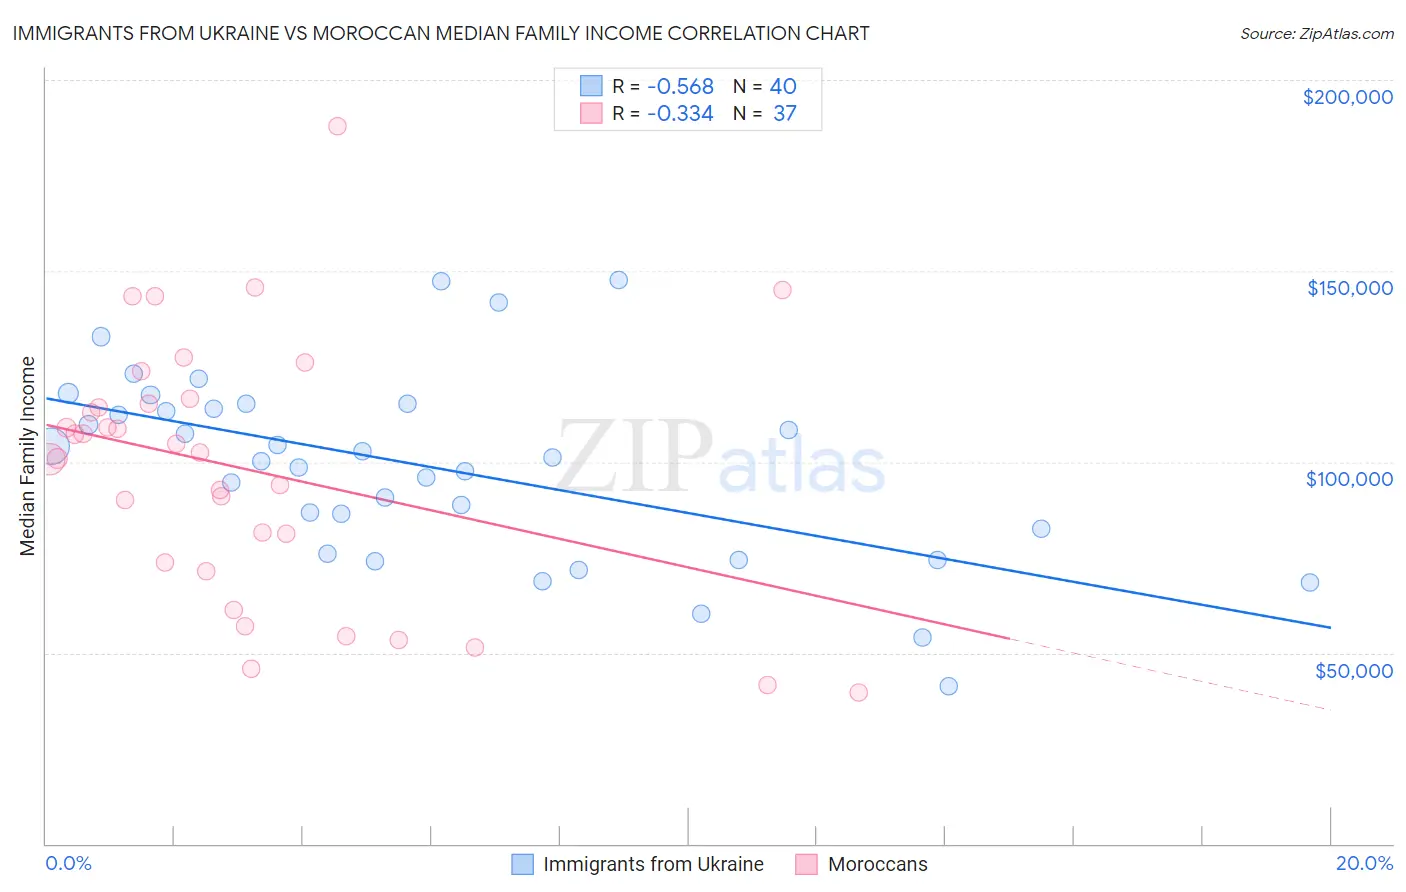
Immigrants from Ukraine vs Moroccan Median Family Income Correlation Chart
The statistical analysis conducted on geographies consisting of 289,573,478 people shows a substantial negative correlation between the proportion of Immigrants from Ukraine and median family income in the United States with a correlation coefficient (R) of -0.568 and weighted average of $109,645. Similarly, the statistical analysis conducted on geographies consisting of 201,715,101 people shows a mild negative correlation between the proportion of Moroccans and median family income in the United States with a correlation coefficient (R) of -0.334 and weighted average of $104,488, a difference of 4.9%.
Median Family Income Correlation Summary
| Measurement | Immigrants from Ukraine | Moroccan |
| Minimum | $41,250 | $39,712 |
| Maximum | $147,711 | $187,788 |
| Range | $106,461 | $148,076 |
| Mean | $98,572 | $98,112 |
| Median | $100,738 | $102,324 |
| Interquartile 25% (IQ1) | $79,127 | $72,461 |
| Interquartile 75% (IQ3) | $114,676 | $115,754 |
| Interquartile Range (IQR) | $35,549 | $43,293 |
| Standard Deviation (Sample) | $24,600 | $33,816 |
| Standard Deviation (Population) | $24,291 | $33,356 |
Similar Demographics by Median Family Income
Demographics Similar to Immigrants from Ukraine by Median Family Income
In terms of median family income, the demographic groups most similar to Immigrants from Ukraine are Macedonian ($109,668, a difference of 0.020%), Assyrian/Chaldean/Syriac ($109,622, a difference of 0.020%), Armenian ($109,692, a difference of 0.040%), Immigrants from Kuwait ($109,731, a difference of 0.080%), and Jordanian ($109,865, a difference of 0.20%).
| Demographics | Rating | Rank | Median Family Income |
| Koreans | 97.8 /100 | #94 | Exceptional $110,103 |
| Zimbabweans | 97.7 /100 | #95 | Exceptional $110,011 |
| Immigrants | Moldova | 97.7 /100 | #96 | Exceptional $109,975 |
| Jordanians | 97.5 /100 | #97 | Exceptional $109,865 |
| Immigrants | Kuwait | 97.4 /100 | #98 | Exceptional $109,731 |
| Armenians | 97.3 /100 | #99 | Exceptional $109,692 |
| Macedonians | 97.3 /100 | #100 | Exceptional $109,668 |
| Immigrants | Ukraine | 97.2 /100 | #101 | Exceptional $109,645 |
| Assyrians/Chaldeans/Syriacs | 97.2 /100 | #102 | Exceptional $109,622 |
| Immigrants | Brazil | 96.9 /100 | #103 | Exceptional $109,418 |
| Palestinians | 96.9 /100 | #104 | Exceptional $109,413 |
| Syrians | 96.7 /100 | #105 | Exceptional $109,299 |
| Albanians | 96.4 /100 | #106 | Exceptional $109,136 |
| Immigrants | North Macedonia | 96.4 /100 | #107 | Exceptional $109,136 |
| Immigrants | Zimbabwe | 95.9 /100 | #108 | Exceptional $108,830 |
Demographics Similar to Moroccans by Median Family Income
In terms of median family income, the demographic groups most similar to Moroccans are Scandinavian ($104,410, a difference of 0.080%), Swiss ($104,396, a difference of 0.090%), Scottish ($104,288, a difference of 0.19%), Icelander ($104,282, a difference of 0.20%), and Basque ($104,760, a difference of 0.26%).
| Demographics | Rating | Rank | Median Family Income |
| Irish | 80.5 /100 | #150 | Excellent $105,453 |
| Peruvians | 80.4 /100 | #151 | Excellent $105,444 |
| Immigrants | Albania | 79.1 /100 | #152 | Good $105,285 |
| Slavs | 77.9 /100 | #153 | Good $105,144 |
| Immigrants | Nepal | 76.3 /100 | #154 | Good $104,966 |
| Native Hawaiians | 75.8 /100 | #155 | Good $104,910 |
| Basques | 74.4 /100 | #156 | Good $104,760 |
| Moroccans | 71.6 /100 | #157 | Good $104,488 |
| Scandinavians | 70.8 /100 | #158 | Good $104,410 |
| Swiss | 70.7 /100 | #159 | Good $104,396 |
| Scottish | 69.5 /100 | #160 | Good $104,288 |
| Icelanders | 69.4 /100 | #161 | Good $104,282 |
| Immigrants | Sierra Leone | 66.2 /100 | #162 | Good $103,990 |
| Costa Ricans | 66.2 /100 | #163 | Good $103,989 |
| Sierra Leoneans | 64.7 /100 | #164 | Good $103,859 |