Immigrants from Uganda vs European Median Family Income
COMPARE
Immigrants from Uganda
European
Median Family Income
Median Family Income Comparison
Immigrants from Uganda
Europeans
$106,188
MEDIAN FAMILY INCOME
85.7/ 100
METRIC RATING
137th/ 347
METRIC RANK
$108,099
MEDIAN FAMILY INCOME
94.1/ 100
METRIC RATING
121st/ 347
METRIC RANK
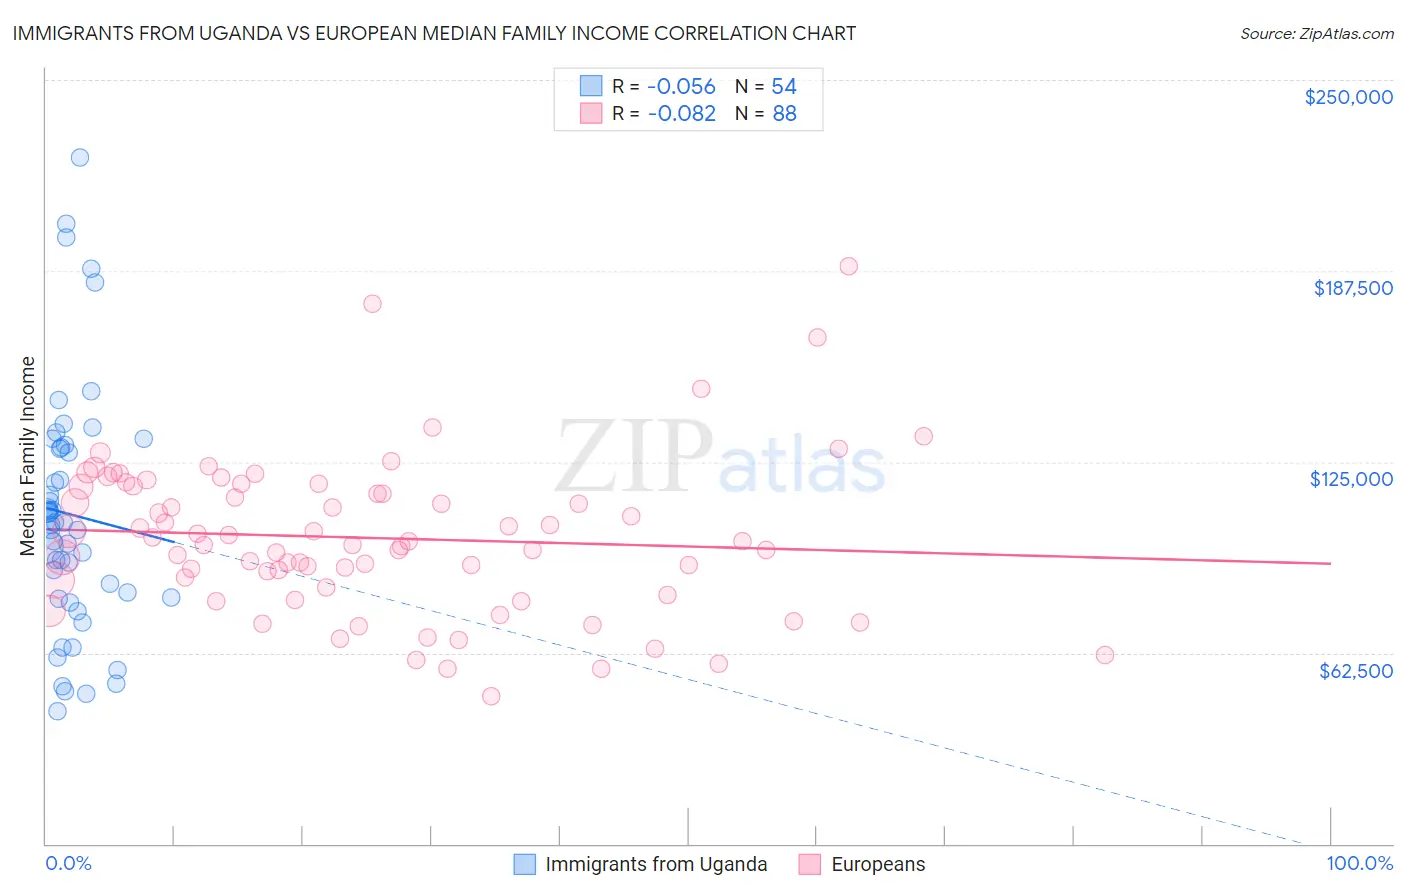
Immigrants from Uganda vs European Median Family Income Correlation Chart
The statistical analysis conducted on geographies consisting of 125,960,521 people shows a slight negative correlation between the proportion of Immigrants from Uganda and median family income in the United States with a correlation coefficient (R) of -0.056 and weighted average of $106,188. Similarly, the statistical analysis conducted on geographies consisting of 560,683,121 people shows a slight negative correlation between the proportion of Europeans and median family income in the United States with a correlation coefficient (R) of -0.082 and weighted average of $108,099, a difference of 1.8%.
Median Family Income Correlation Summary
| Measurement | Immigrants from Uganda | European |
| Minimum | $43,204 | $48,174 |
| Maximum | $224,567 | $188,913 |
| Range | $181,363 | $140,739 |
| Mean | $107,720 | $100,086 |
| Median | $104,727 | $98,374 |
| Interquartile 25% (IQ1) | $80,714 | $85,153 |
| Interquartile 75% (IQ3) | $129,701 | $116,940 |
| Interquartile Range (IQR) | $48,987 | $31,788 |
| Standard Deviation (Sample) | $40,035 | $25,416 |
| Standard Deviation (Population) | $39,663 | $25,271 |
Demographics Similar to Immigrants from Uganda and Europeans by Median Family Income
In terms of median family income, the demographic groups most similar to Immigrants from Uganda are Immigrants from Vietnam ($106,186, a difference of 0.0%), Luxembourger ($106,183, a difference of 0.0%), Immigrants from South Eastern Asia ($106,252, a difference of 0.060%), Portuguese ($106,286, a difference of 0.090%), and Immigrants from Oceania ($106,453, a difference of 0.25%). Similarly, the demographic groups most similar to Europeans are Immigrants from Northern Africa ($108,161, a difference of 0.060%), Sri Lankan ($108,234, a difference of 0.12%), Immigrants from Jordan ($107,715, a difference of 0.36%), Carpatho Rusyn ($107,502, a difference of 0.55%), and Pakistani ($107,390, a difference of 0.66%).
| Demographics | Rating | Rank | Median Family Income |
| Sri Lankans | 94.5 /100 | #119 | Exceptional $108,234 |
| Immigrants | Northern Africa | 94.3 /100 | #120 | Exceptional $108,161 |
| Europeans | 94.1 /100 | #121 | Exceptional $108,099 |
| Immigrants | Jordan | 92.9 /100 | #122 | Exceptional $107,715 |
| Carpatho Rusyns | 92.2 /100 | #123 | Exceptional $107,502 |
| Pakistanis | 91.7 /100 | #124 | Exceptional $107,390 |
| Taiwanese | 91.4 /100 | #125 | Exceptional $107,295 |
| Serbians | 90.8 /100 | #126 | Exceptional $107,157 |
| Lebanese | 90.5 /100 | #127 | Exceptional $107,086 |
| Immigrants | Ethiopia | 90.0 /100 | #128 | Excellent $106,969 |
| Arabs | 89.9 /100 | #129 | Excellent $106,952 |
| Brazilians | 89.8 /100 | #130 | Excellent $106,942 |
| Canadians | 88.1 /100 | #131 | Excellent $106,597 |
| Immigrants | Fiji | 87.8 /100 | #132 | Excellent $106,544 |
| Ugandans | 87.8 /100 | #133 | Excellent $106,541 |
| Immigrants | Oceania | 87.3 /100 | #134 | Excellent $106,453 |
| Portuguese | 86.3 /100 | #135 | Excellent $106,286 |
| Immigrants | South Eastern Asia | 86.1 /100 | #136 | Excellent $106,252 |
| Immigrants | Uganda | 85.7 /100 | #137 | Excellent $106,188 |
| Immigrants | Vietnam | 85.7 /100 | #138 | Excellent $106,186 |
| Luxembourgers | 85.7 /100 | #139 | Excellent $106,183 |