Iraqi vs European Median Family Income
COMPARE
Iraqi
European
Median Family Income
Median Family Income Comparison
Iraqis
Europeans
$100,658
MEDIAN FAMILY INCOME
26.3/ 100
METRIC RATING
193rd/ 347
METRIC RANK
$108,099
MEDIAN FAMILY INCOME
94.1/ 100
METRIC RATING
121st/ 347
METRIC RANK
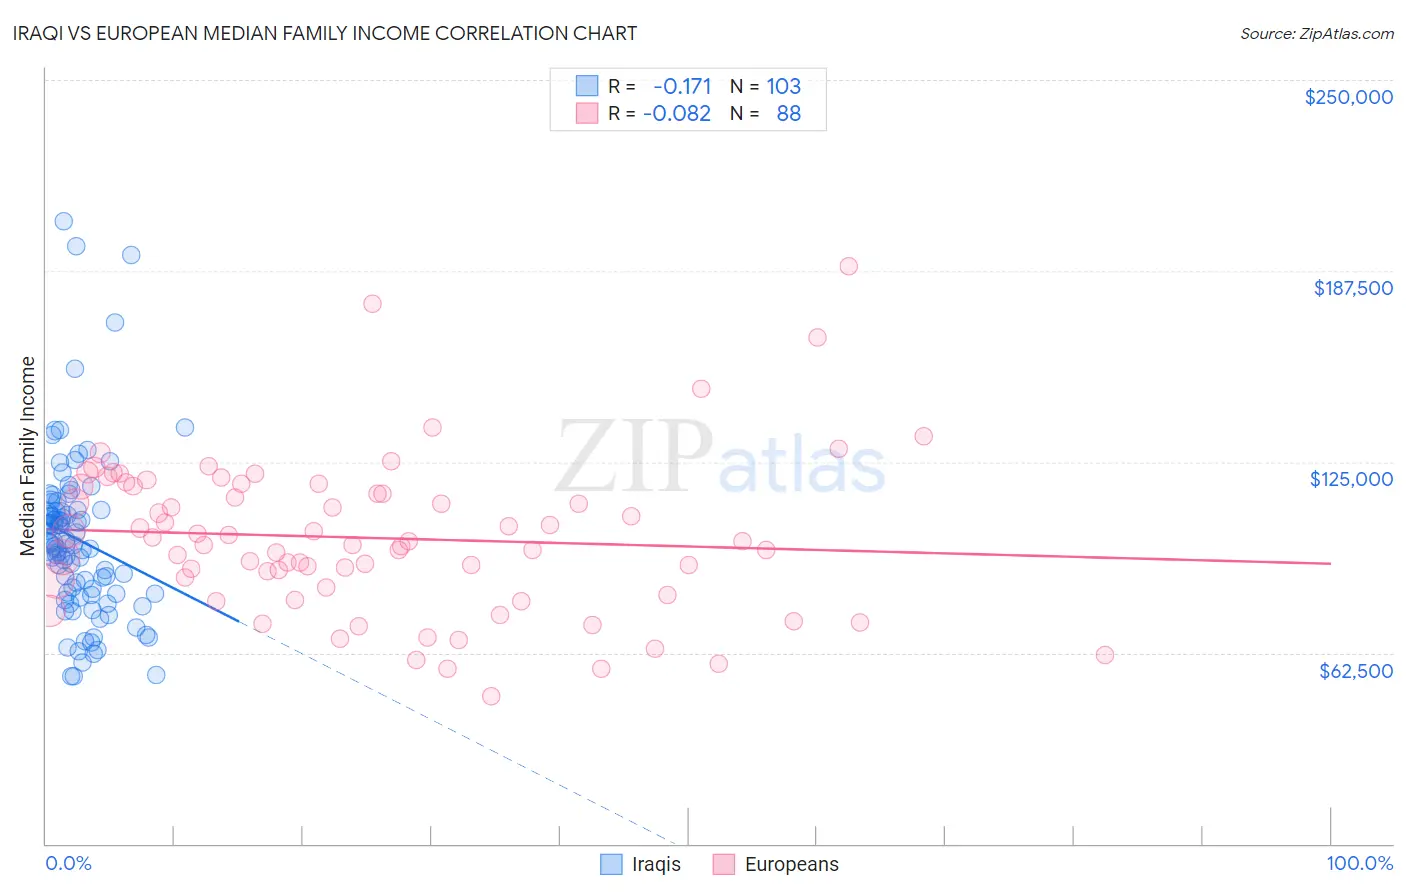
Iraqi vs European Median Family Income Correlation Chart
The statistical analysis conducted on geographies consisting of 170,585,790 people shows a poor negative correlation between the proportion of Iraqis and median family income in the United States with a correlation coefficient (R) of -0.171 and weighted average of $100,658. Similarly, the statistical analysis conducted on geographies consisting of 560,683,121 people shows a slight negative correlation between the proportion of Europeans and median family income in the United States with a correlation coefficient (R) of -0.082 and weighted average of $108,099, a difference of 7.4%.
Median Family Income Correlation Summary
| Measurement | Iraqi | European |
| Minimum | $54,690 | $48,174 |
| Maximum | $203,844 | $188,913 |
| Range | $149,154 | $140,739 |
| Mean | $99,589 | $100,086 |
| Median | $97,704 | $98,374 |
| Interquartile 25% (IQ1) | $81,823 | $85,153 |
| Interquartile 75% (IQ3) | $109,149 | $116,940 |
| Interquartile Range (IQR) | $27,326 | $31,788 |
| Standard Deviation (Sample) | $27,377 | $25,416 |
| Standard Deviation (Population) | $27,244 | $25,271 |
Similar Demographics by Median Family Income
Demographics Similar to Iraqis by Median Family Income
In terms of median family income, the demographic groups most similar to Iraqis are Uruguayan ($100,656, a difference of 0.0%), Immigrants from Kenya ($100,679, a difference of 0.020%), Colombian ($100,750, a difference of 0.090%), Immigrants from South America ($100,414, a difference of 0.24%), and Immigrants ($100,962, a difference of 0.30%).
| Demographics | Rating | Rank | Median Family Income |
| Celtics | 31.3 /100 | #186 | Fair $101,139 |
| Tlingit-Haida | 30.8 /100 | #187 | Fair $101,092 |
| Guamanians/Chamorros | 30.5 /100 | #188 | Fair $101,061 |
| Immigrants | Portugal | 29.6 /100 | #189 | Fair $100,984 |
| Immigrants | Immigrants | 29.4 /100 | #190 | Fair $100,962 |
| Colombians | 27.2 /100 | #191 | Fair $100,750 |
| Immigrants | Kenya | 26.5 /100 | #192 | Fair $100,679 |
| Iraqis | 26.3 /100 | #193 | Fair $100,658 |
| Uruguayans | 26.3 /100 | #194 | Fair $100,656 |
| Immigrants | South America | 23.9 /100 | #195 | Fair $100,414 |
| Samoans | 23.3 /100 | #196 | Fair $100,344 |
| Immigrants | Cameroon | 22.8 /100 | #197 | Fair $100,289 |
| Immigrants | Africa | 22.5 /100 | #198 | Fair $100,256 |
| Yugoslavians | 21.3 /100 | #199 | Fair $100,119 |
| Spanish | 20.1 /100 | #200 | Fair $99,977 |
Demographics Similar to Europeans by Median Family Income
In terms of median family income, the demographic groups most similar to Europeans are Immigrants from Northern Africa ($108,161, a difference of 0.060%), Sri Lankan ($108,234, a difference of 0.12%), Ethiopian ($108,251, a difference of 0.14%), Immigrants from Philippines ($108,288, a difference of 0.18%), and Chilean ($108,429, a difference of 0.31%).
| Demographics | Rating | Rank | Median Family Income |
| Poles | 95.2 /100 | #114 | Exceptional $108,507 |
| Swedes | 95.1 /100 | #115 | Exceptional $108,499 |
| Chileans | 95.0 /100 | #116 | Exceptional $108,429 |
| Immigrants | Philippines | 94.6 /100 | #117 | Exceptional $108,288 |
| Ethiopians | 94.5 /100 | #118 | Exceptional $108,251 |
| Sri Lankans | 94.5 /100 | #119 | Exceptional $108,234 |
| Immigrants | Northern Africa | 94.3 /100 | #120 | Exceptional $108,161 |
| Europeans | 94.1 /100 | #121 | Exceptional $108,099 |
| Immigrants | Jordan | 92.9 /100 | #122 | Exceptional $107,715 |
| Carpatho Rusyns | 92.2 /100 | #123 | Exceptional $107,502 |
| Pakistanis | 91.7 /100 | #124 | Exceptional $107,390 |
| Taiwanese | 91.4 /100 | #125 | Exceptional $107,295 |
| Serbians | 90.8 /100 | #126 | Exceptional $107,157 |
| Lebanese | 90.5 /100 | #127 | Exceptional $107,086 |
| Immigrants | Ethiopia | 90.0 /100 | #128 | Excellent $106,969 |