Immigrants from Philippines vs Immigrants from Senegal Wage/Income Gap
COMPARE
Immigrants from Philippines
Immigrants from Senegal
Wage/Income Gap
Wage/Income Gap Comparison
Immigrants from Philippines
Immigrants from Senegal
24.7%
WAGE/INCOME GAP
93.0/ 100
METRIC RATING
131st/ 347
METRIC RANK
20.9%
WAGE/INCOME GAP
100.0/ 100
METRIC RATING
29th/ 347
METRIC RANK
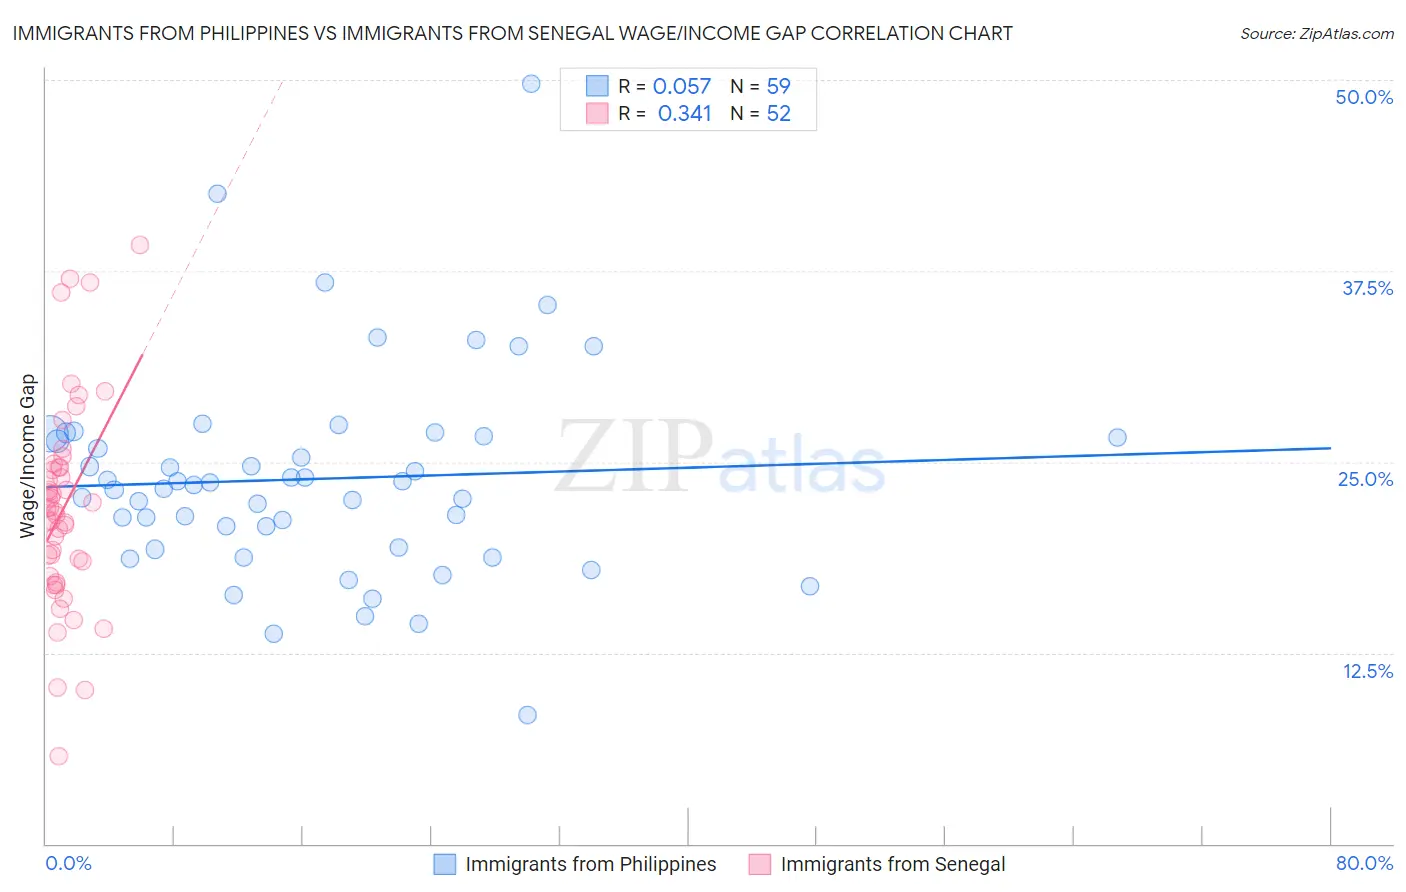
Immigrants from Philippines vs Immigrants from Senegal Wage/Income Gap Correlation Chart
The statistical analysis conducted on geographies consisting of 470,842,100 people shows a slight positive correlation between the proportion of Immigrants from Philippines and wage/income gap percentage in the United States with a correlation coefficient (R) of 0.057 and weighted average of 24.7%. Similarly, the statistical analysis conducted on geographies consisting of 90,124,089 people shows a mild positive correlation between the proportion of Immigrants from Senegal and wage/income gap percentage in the United States with a correlation coefficient (R) of 0.341 and weighted average of 20.9%, a difference of 18.1%.
Wage/Income Gap Correlation Summary
| Measurement | Immigrants from Philippines | Immigrants from Senegal |
| Minimum | 8.4% | 5.7% |
| Maximum | 49.7% | 39.2% |
| Range | 41.3% | 33.4% |
| Mean | 23.9% | 22.0% |
| Median | 23.5% | 21.9% |
| Interquartile 25% (IQ1) | 19.4% | 18.0% |
| Interquartile 75% (IQ3) | 26.6% | 24.6% |
| Interquartile Range (IQR) | 7.3% | 6.6% |
| Standard Deviation (Sample) | 6.8% | 6.6% |
| Standard Deviation (Population) | 6.8% | 6.6% |
Similar Demographics by Wage/Income Gap
Demographics Similar to Immigrants from Philippines by Wage/Income Gap
In terms of wage/income gap, the demographic groups most similar to Immigrants from Philippines are Alsatian (24.7%, a difference of 0.070%), Yup'ik (24.7%, a difference of 0.090%), Immigrants from Central America (24.6%, a difference of 0.15%), Immigrants from Costa Rica (24.7%, a difference of 0.15%), and Colombian (24.7%, a difference of 0.15%).
| Demographics | Rating | Rank | Wage/Income Gap |
| Immigrants | South America | 93.9 /100 | #124 | Exceptional 24.6% |
| Spanish Americans | 93.8 /100 | #125 | Exceptional 24.6% |
| Immigrants | Uruguay | 93.8 /100 | #126 | Exceptional 24.6% |
| German Russians | 93.7 /100 | #127 | Exceptional 24.6% |
| Immigrants | Central America | 93.5 /100 | #128 | Exceptional 24.6% |
| Yup'ik | 93.3 /100 | #129 | Exceptional 24.7% |
| Alsatians | 93.2 /100 | #130 | Exceptional 24.7% |
| Immigrants | Philippines | 93.0 /100 | #131 | Exceptional 24.7% |
| Immigrants | Costa Rica | 92.4 /100 | #132 | Exceptional 24.7% |
| Colombians | 92.4 /100 | #133 | Exceptional 24.7% |
| Mexican American Indians | 92.2 /100 | #134 | Exceptional 24.7% |
| South American Indians | 92.0 /100 | #135 | Exceptional 24.7% |
| Armenians | 91.3 /100 | #136 | Exceptional 24.8% |
| Immigrants | South Eastern Asia | 90.9 /100 | #137 | Exceptional 24.8% |
| Immigrants | Bosnia and Herzegovina | 90.1 /100 | #138 | Exceptional 24.8% |
Demographics Similar to Immigrants from Senegal by Wage/Income Gap
In terms of wage/income gap, the demographic groups most similar to Immigrants from Senegal are Immigrants from Bangladesh (20.9%, a difference of 0.21%), Vietnamese (21.0%, a difference of 0.49%), Inupiat (20.8%, a difference of 0.62%), Immigrants from Yemen (21.1%, a difference of 0.73%), and Immigrants from Bahamas (21.1%, a difference of 0.74%).
| Demographics | Rating | Rank | Wage/Income Gap |
| Immigrants | Liberia | 100.0 /100 | #22 | Exceptional 20.6% |
| Immigrants | Dominican Republic | 100.0 /100 | #23 | Exceptional 20.6% |
| Dominicans | 100.0 /100 | #24 | Exceptional 20.6% |
| Senegalese | 100.0 /100 | #25 | Exceptional 20.7% |
| Pueblo | 100.0 /100 | #26 | Exceptional 20.7% |
| Immigrants | Armenia | 100.0 /100 | #27 | Exceptional 20.7% |
| Inupiat | 100.0 /100 | #28 | Exceptional 20.8% |
| Immigrants | Senegal | 100.0 /100 | #29 | Exceptional 20.9% |
| Immigrants | Bangladesh | 100.0 /100 | #30 | Exceptional 20.9% |
| Vietnamese | 100.0 /100 | #31 | Exceptional 21.0% |
| Immigrants | Yemen | 100.0 /100 | #32 | Exceptional 21.1% |
| Immigrants | Bahamas | 100.0 /100 | #33 | Exceptional 21.1% |
| Pima | 100.0 /100 | #34 | Exceptional 21.1% |
| Somalis | 100.0 /100 | #35 | Exceptional 21.2% |
| Belizeans | 100.0 /100 | #36 | Exceptional 21.2% |