Immigrants from Philippines vs Latvian Wage/Income Gap
COMPARE
Immigrants from Philippines
Latvian
Wage/Income Gap
Wage/Income Gap Comparison
Immigrants from Philippines
Latvians
24.7%
WAGE/INCOME GAP
93.0/ 100
METRIC RATING
131st/ 347
METRIC RANK
27.9%
WAGE/INCOME GAP
0.7/ 100
METRIC RATING
277th/ 347
METRIC RANK
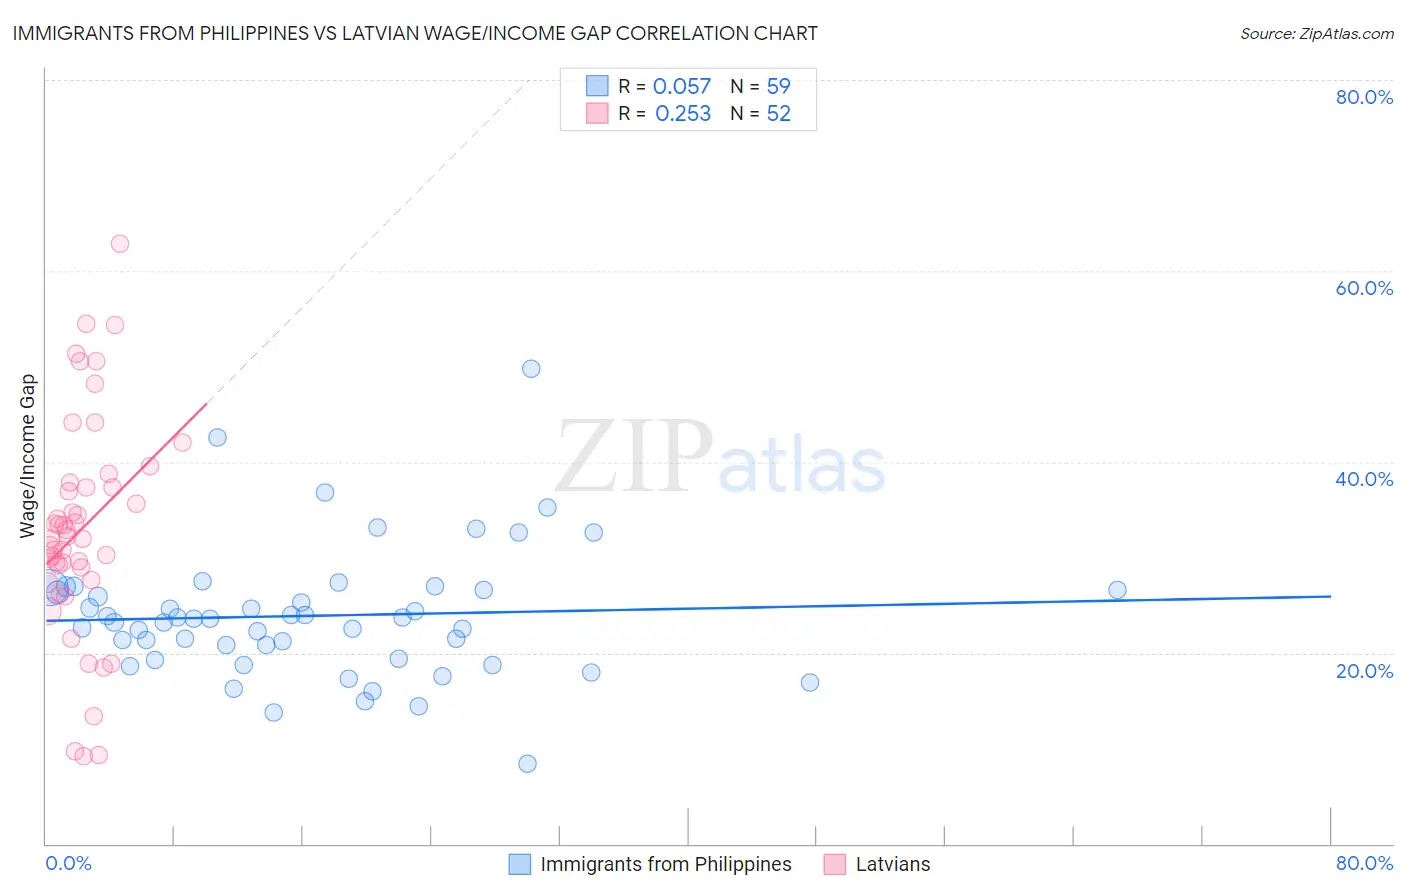
Immigrants from Philippines vs Latvian Wage/Income Gap Correlation Chart
The statistical analysis conducted on geographies consisting of 470,842,100 people shows a slight positive correlation between the proportion of Immigrants from Philippines and wage/income gap percentage in the United States with a correlation coefficient (R) of 0.057 and weighted average of 24.7%. Similarly, the statistical analysis conducted on geographies consisting of 220,666,647 people shows a weak positive correlation between the proportion of Latvians and wage/income gap percentage in the United States with a correlation coefficient (R) of 0.253 and weighted average of 27.9%, a difference of 12.9%.
Wage/Income Gap Correlation Summary
| Measurement | Immigrants from Philippines | Latvian |
| Minimum | 8.4% | 9.2% |
| Maximum | 49.7% | 62.8% |
| Range | 41.3% | 53.6% |
| Mean | 23.9% | 32.9% |
| Median | 23.5% | 32.1% |
| Interquartile 25% (IQ1) | 19.4% | 28.3% |
| Interquartile 75% (IQ3) | 26.6% | 37.6% |
| Interquartile Range (IQR) | 7.3% | 9.3% |
| Standard Deviation (Sample) | 6.8% | 11.4% |
| Standard Deviation (Population) | 6.8% | 11.3% |
Similar Demographics by Wage/Income Gap
Demographics Similar to Immigrants from Philippines by Wage/Income Gap
In terms of wage/income gap, the demographic groups most similar to Immigrants from Philippines are Alsatian (24.7%, a difference of 0.070%), Yup'ik (24.7%, a difference of 0.090%), Immigrants from Central America (24.6%, a difference of 0.15%), Immigrants from Costa Rica (24.7%, a difference of 0.15%), and Colombian (24.7%, a difference of 0.15%).
| Demographics | Rating | Rank | Wage/Income Gap |
| Immigrants | South America | 93.9 /100 | #124 | Exceptional 24.6% |
| Spanish Americans | 93.8 /100 | #125 | Exceptional 24.6% |
| Immigrants | Uruguay | 93.8 /100 | #126 | Exceptional 24.6% |
| German Russians | 93.7 /100 | #127 | Exceptional 24.6% |
| Immigrants | Central America | 93.5 /100 | #128 | Exceptional 24.6% |
| Yup'ik | 93.3 /100 | #129 | Exceptional 24.7% |
| Alsatians | 93.2 /100 | #130 | Exceptional 24.7% |
| Immigrants | Philippines | 93.0 /100 | #131 | Exceptional 24.7% |
| Immigrants | Costa Rica | 92.4 /100 | #132 | Exceptional 24.7% |
| Colombians | 92.4 /100 | #133 | Exceptional 24.7% |
| Mexican American Indians | 92.2 /100 | #134 | Exceptional 24.7% |
| South American Indians | 92.0 /100 | #135 | Exceptional 24.7% |
| Armenians | 91.3 /100 | #136 | Exceptional 24.8% |
| Immigrants | South Eastern Asia | 90.9 /100 | #137 | Exceptional 24.8% |
| Immigrants | Bosnia and Herzegovina | 90.1 /100 | #138 | Exceptional 24.8% |
Demographics Similar to Latvians by Wage/Income Gap
In terms of wage/income gap, the demographic groups most similar to Latvians are Lebanese (27.9%, a difference of 0.0%), Immigrants from Japan (27.9%, a difference of 0.030%), Immigrants from England (27.9%, a difference of 0.080%), American (27.8%, a difference of 0.11%), and Bulgarian (27.8%, a difference of 0.15%).
| Demographics | Rating | Rank | Wage/Income Gap |
| Immigrants | Western Europe | 0.9 /100 | #270 | Tragic 27.8% |
| Ute | 0.8 /100 | #271 | Tragic 27.8% |
| Immigrants | Korea | 0.8 /100 | #272 | Tragic 27.8% |
| Bulgarians | 0.7 /100 | #273 | Tragic 27.8% |
| Americans | 0.7 /100 | #274 | Tragic 27.8% |
| Immigrants | Japan | 0.7 /100 | #275 | Tragic 27.9% |
| Lebanese | 0.7 /100 | #276 | Tragic 27.9% |
| Latvians | 0.7 /100 | #277 | Tragic 27.9% |
| Immigrants | England | 0.6 /100 | #278 | Tragic 27.9% |
| Romanians | 0.5 /100 | #279 | Tragic 28.0% |
| Russians | 0.5 /100 | #280 | Tragic 28.0% |
| Burmese | 0.5 /100 | #281 | Tragic 28.0% |
| South Africans | 0.5 /100 | #282 | Tragic 28.0% |
| French Canadians | 0.4 /100 | #283 | Tragic 28.1% |
| Immigrants | Sweden | 0.4 /100 | #284 | Tragic 28.1% |