Immigrants from India vs Immigrants from Senegal Wage/Income Gap
COMPARE
Immigrants from India
Immigrants from Senegal
Wage/Income Gap
Wage/Income Gap Comparison
Immigrants from India
Immigrants from Senegal
31.5%
WAGE/INCOME GAP
0.0/ 100
METRIC RATING
345th/ 347
METRIC RANK
20.9%
WAGE/INCOME GAP
100.0/ 100
METRIC RATING
29th/ 347
METRIC RANK
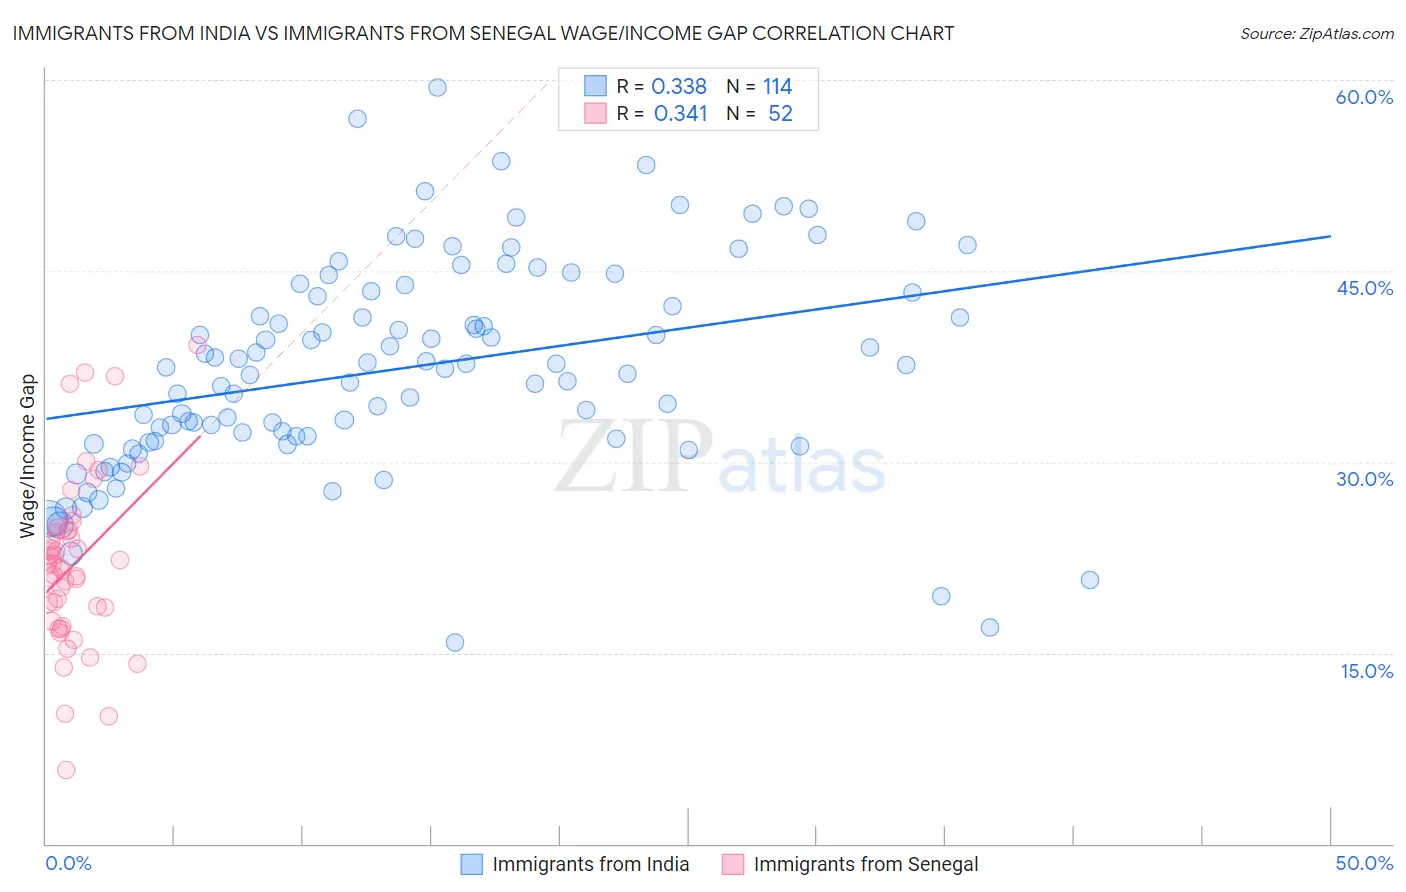
Immigrants from India vs Immigrants from Senegal Wage/Income Gap Correlation Chart
The statistical analysis conducted on geographies consisting of 433,863,645 people shows a mild positive correlation between the proportion of Immigrants from India and wage/income gap percentage in the United States with a correlation coefficient (R) of 0.338 and weighted average of 31.5%. Similarly, the statistical analysis conducted on geographies consisting of 90,124,089 people shows a mild positive correlation between the proportion of Immigrants from Senegal and wage/income gap percentage in the United States with a correlation coefficient (R) of 0.341 and weighted average of 20.9%, a difference of 50.9%.
Wage/Income Gap Correlation Summary
| Measurement | Immigrants from India | Immigrants from Senegal |
| Minimum | 15.8% | 5.7% |
| Maximum | 59.4% | 39.2% |
| Range | 43.7% | 33.4% |
| Mean | 37.4% | 22.0% |
| Median | 37.5% | 21.9% |
| Interquartile 25% (IQ1) | 31.8% | 18.0% |
| Interquartile 75% (IQ3) | 43.3% | 24.6% |
| Interquartile Range (IQR) | 11.5% | 6.6% |
| Standard Deviation (Sample) | 8.3% | 6.6% |
| Standard Deviation (Population) | 8.3% | 6.6% |
Similar Demographics by Wage/Income Gap
Demographics Similar to Immigrants from India by Wage/Income Gap
In terms of wage/income gap, the demographic groups most similar to Immigrants from India are Assyrian/Chaldean/Syriac (31.0%, a difference of 1.7%), Danish (31.0%, a difference of 1.8%), Pennsylvania German (30.7%, a difference of 2.7%), Thai (30.5%, a difference of 3.5%), and Swiss (30.0%, a difference of 5.2%).
| Demographics | Rating | Rank | Wage/Income Gap |
| Europeans | 0.0 /100 | #333 | Tragic 29.4% |
| Swedes | 0.0 /100 | #334 | Tragic 29.4% |
| Immigrants | Taiwan | 0.0 /100 | #335 | Tragic 29.5% |
| English | 0.0 /100 | #336 | Tragic 29.5% |
| Dutch | 0.0 /100 | #337 | Tragic 29.6% |
| Filipinos | 0.0 /100 | #338 | Tragic 29.7% |
| Iranians | 0.0 /100 | #339 | Tragic 29.7% |
| Swiss | 0.0 /100 | #340 | Tragic 30.0% |
| Thais | 0.0 /100 | #341 | Tragic 30.5% |
| Pennsylvania Germans | 0.0 /100 | #342 | Tragic 30.7% |
| Danes | 0.0 /100 | #343 | Tragic 31.0% |
| Assyrians/Chaldeans/Syriacs | 0.0 /100 | #344 | Tragic 31.0% |
| Immigrants | India | 0.0 /100 | #345 | Tragic 31.5% |
| Cajuns | 0.0 /100 | #346 | Tragic 33.9% |
| Houma | 0.0 /100 | #347 | Tragic 38.7% |
Demographics Similar to Immigrants from Senegal by Wage/Income Gap
In terms of wage/income gap, the demographic groups most similar to Immigrants from Senegal are Immigrants from Bangladesh (20.9%, a difference of 0.21%), Vietnamese (21.0%, a difference of 0.49%), Inupiat (20.8%, a difference of 0.62%), Immigrants from Yemen (21.1%, a difference of 0.73%), and Immigrants from Bahamas (21.1%, a difference of 0.74%).
| Demographics | Rating | Rank | Wage/Income Gap |
| Immigrants | Liberia | 100.0 /100 | #22 | Exceptional 20.6% |
| Immigrants | Dominican Republic | 100.0 /100 | #23 | Exceptional 20.6% |
| Dominicans | 100.0 /100 | #24 | Exceptional 20.6% |
| Senegalese | 100.0 /100 | #25 | Exceptional 20.7% |
| Pueblo | 100.0 /100 | #26 | Exceptional 20.7% |
| Immigrants | Armenia | 100.0 /100 | #27 | Exceptional 20.7% |
| Inupiat | 100.0 /100 | #28 | Exceptional 20.8% |
| Immigrants | Senegal | 100.0 /100 | #29 | Exceptional 20.9% |
| Immigrants | Bangladesh | 100.0 /100 | #30 | Exceptional 20.9% |
| Vietnamese | 100.0 /100 | #31 | Exceptional 21.0% |
| Immigrants | Yemen | 100.0 /100 | #32 | Exceptional 21.1% |
| Immigrants | Bahamas | 100.0 /100 | #33 | Exceptional 21.1% |
| Pima | 100.0 /100 | #34 | Exceptional 21.1% |
| Somalis | 100.0 /100 | #35 | Exceptional 21.2% |
| Belizeans | 100.0 /100 | #36 | Exceptional 21.2% |